Des schémas TikZ et leurs codes en libre service.
TikZ permet vraiment de réaliser des schémas irréprochables !
Je me suis beaucoup aidé de TikZ-Impatient et de Visuel_TikZ
Avec un clic droit, il est possible de télécharger l'image au format .png, sinon il suffit de cliquer sur l'image pour faire apparaître le code Tik'Z.
Bien sûr, le code peut être amélioré, merci alors de prendre contact.
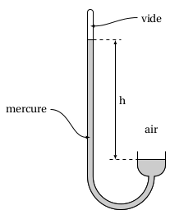
Pression
 |
 |
 |
%baromètre
\begin{tikzpicture}[scale=0.09]
\draw (0,0) -- (0,-5) arc (-180:-90:4) arc (0:-180:10) -- (-16,50) arc (0:180:1) -- (-18,-9) arc (-180:0:12) arc (-90:0:4) -- (10,0);
\draw (0,-3) -- (10,-3);
\draw (-18,40) -- (-16,40);
\node (vide) at (5,48) {vide};
\node (air) at (5,8) {air};
\node (mercure) at (-40,15) {mercure};
%remplissage
\filldraw [fill=gray!40]
(0,-3) -- (0,-5) arc (-180:-90:4) arc (0:-180:10) -- (-16,40) --(-18,40) -- (-18,-9) arc (-180:0:12) arc (-90:0:4) -- (10,-3) -- (0,-3) -- cycle;
%fin remplissage
\draw[->,>=latex] (vide) to[out=180,in=0] (-17,45);
\draw[->,>=latex] (mercure) to[out=0,in=180] (-17,5);
\draw [dashed] (-16,40) -- (-6,40);
\draw [dashed] (-10,-3) -- (0,-3);
\draw [<->,>=latex] (-8,-3) -- (-8,40) node [midway,right] {h};
\end{tikzpicture}
%fin baromètre
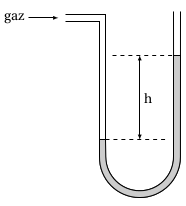
%manomètre à eau
\begin{tikzpicture}[scale=0.09]
\node (A) at (-15,1) {gaz};
\draw (0,0) -- (10,0) -- (10,-40) arc (-180:0:12) -- (34,3);
\draw (0,2) -- (12,2) -- (12,-40) arc (-180:0:10) -- (32,3);
\draw (10,-35) -- (12,-35);
\draw (32,-10) -- (34,-10);
\draw [dashed] (12,-35) -- (30,-35);
\draw [dashed] (14,-10) -- (32,-10);
\draw [<->,>=latex] (22,-35) -- (22,-10) node [midway,right] {h};
\draw [->,>=latex] (A) -- (-2,1);
%remplissage
\filldraw [fill=gray!40]
(10,-35) -- (10,-40) arc (-180:0:12) -- (34,-10) --(32,-10) -- (32,-40) arc (0:-180:10) -- (12,-35) -- (10,-35) -- cycle;
%fin remplissage
\end{tikzpicture}
%fin manomètre à eau
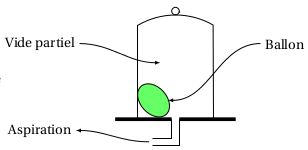
%cloche à vide
\begin{tikzpicture}[scale=0.1]
\node (A) at (-30,2) {Aspiration};
\node (V) at (-30, 25) {Vide partiel};
\node (O) at (35,25) {Ballon};
\draw [->,>=latex] (V) to[out=0,in=180] (2,20);
\draw [<-,>=latex] (A) to[out=0,in=180] (-1,-1);
\draw [->,>=latex] (O) to[out=180,in=0] (4,10);
\draw (0,0) -- (5,0) -- (5,5);
\draw (0,-2) -- (7,-2) -- (7,5);
\draw (-4,5) -- (-4,30) arc (120:60:20) -- (16,5);
\draw (6,33.7) circle (1);
\draw [line width=0.1cm] (5,5) -- (-10,5);
\draw [line width=0.1cm] (7,5) -- (22,5);
\draw [fill=green!60,rotate around={-48.21:(0.2,10)}] (0.2,10) ellipse (5cm and 3.5cm);
\end{tikzpicture}
%fin cloche à vide
 |
 |
 |
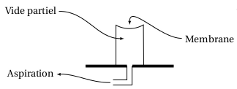
%schéma aspiration
\begin{tikzpicture}[scale=0.1]
\node (A) at (-30,2) {Aspiration};
\node (V) at (-30, 25) {Vide partiel};
\node (O) at (35,15) {Membrane};
\draw [->,>=latex] (V) to[out=0,in=180] (4,15);
\draw [<-,>=latex] (A) to[out=0,in=180] (-1,-1);
\draw [->,>=latex] (O) to[out=180,in=90] (6,20);
\draw (0,0) -- (5,0) -- (5,5);
\draw (0,-2) -- (7,-2) -- (7,5);
\draw (1,5) -- (1,20) arc (-120:-60:10) -- (11,5);
\draw [line width=0.1cm] (5,5) -- (-10,5);
\draw [line width=0.1cm] (7,5) -- (22,5);
\end{tikzpicture}
%fin schéma aspiration
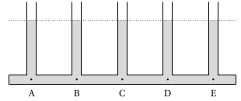
%Statique des fluides
\begin{tikzpicture}[scale=0.7]
\fill [color=gray!30] (0,0) --++ (1,0) --++ (0,3) --++ (0.5,0) --++(0,-3) --++ (2,0) --++ (0,3) --++ (0.5,0) --++(0,-3) --++ (2,0) --++ (0,3) --++ (0.5,0) --++(0,-3) --++ (2,0) --++ (0,3) --++ (0.5,0) --++(0,-3) --++ (2,0) --++ (0,3) --++ (0.5,0) --++ (0,-3) --++ (1,0) --++ (0,-0.5) --++ (-12.5,0) -- cycle;
\draw (0,0) --++ (1,0) --++ (0,4);
\draw (1.5,4) --++ (0,-4) --++ (2,0) --++ (0,4);
\draw (4,4) --++ (0,-4) --++ (2,0) --++ (0,4);
\draw (6.5,4) --++ (0,-4) --++ (2,0) --++ (0,4);
\draw (9,4) --++ (0,-4) --++ (2,0) --++ (0,4);
\draw (11.5,4) --++ (0,-4) --++ (1,0);
\draw (0,-0.5) --++ (12.5,0);
\draw (0,0) --++ (0,-0.5);
\draw (12.5,0) --++ (0,-0.5);
\draw [dotted] (0,3) --++ (12.5,0);
\foreach \x in {1.25,3.75,...,11.25} \fill(\x,-0.25) circle (0.05);
\node at (1.25,-1) {A};
\node at (3.75,-1) {B};
\node at (6.25,-1) {C};
\node at (8.75,-1) {D};
\node at (11.25,-1) {E};
\end{tikzpicture}
%Fin statique des fluides
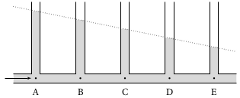
%Ecoulement
\begin{tikzpicture}[scale=0.7]
\fill [color=gray!30] (0,0) --++ (1,0) --++ (0,3.5) --++ (0.5,0) --++(0,-3.5) --++ (2,0) --++ (0,3) --++ (0.5,0) --++(0,-3) --++ (2,0) --++ (0,2.5) --++ (0.5,0) --++(0,-2.5) --++ (2,0) --++ (0,2) --++ (0.5,0) --++(0,-2) --++ (2,0) --++ (0,1.5) --++ (0.5,0) --++ (0,-1.5) --++ (1,0) --++ (0,-0.5) --++ (-12.5,0) -- cycle;
\draw (0,0) --++ (1,0) --++ (0,4);
\draw (1.5,4) --++ (0,-4) --++ (2,0) --++ (0,4);
\draw (4,4) --++ (0,-4) --++ (2,0) --++ (0,4);
\draw (6.5,4) --++ (0,-4) --++ (2,0) --++ (0,4);
\draw (9,4) --++ (0,-4) --++ (2,0) --++ (0,4);
\draw (11.5,4) --++ (0,-4) --++ (1,0);
\draw (0,-0.5) --++ (12.5,0);
\draw [->,>=latex] (-0.5,-0.25) --++ (1.5,0);
\foreach \x in {1.25,3.75,...,11.25} \fill(\x,-0.25) circle (0.05);
\node at (1.25,-1) {A};
\node at (3.75,-1) {B};
\node at (6.25,-1) {C};
\node at (8.75,-1) {D};
\node at (11.25,-1) {E};
\draw [dotted] (0,3.75) --++ (12.5,-2.5);
\end{tikzpicture}
%Fin écoulement
 |
 |
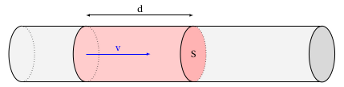
%Débit à travers un tuyau
\begin{tikzpicture}[scale=0.8]
\draw [<->,>=latex] (3,0.5) --++ (5,0)node [midway,above]{d};
\fill [color=gray!10] (0,0)rectangle(14,-2.6);
\fill [color=gray!10,rotate around={90:(0,0)}] (-1.3,0) ellipse (1.3cm and 0.6cm);
\fill [color=red!20] (3,0)rectangle(8,-2.6);
\fill [color=red!20,rotate around={90:(0,0)}] (-1.3,-3) ellipse (1.3cm and 0.6cm);
\fill [color=red!30,rotate around={90:(0,0)}] (-1.3,-8) ellipse (1.3cm and 0.6cm);
\draw (0,0) --++ (14,0);
\draw (0,-2.6) --++ (14,0);
\draw [dotted] (0,-2.6) arc(-90:90:0.6 and 1.3);
\draw [dotted] (3,-2.6) arc(-90:90:0.6 and 1.3);
\draw [dotted] (8,-2.6) arc(-90:90:0.6 and 1.3);
\draw (0,-2.6) arc(270:90:0.6 and 1.3);
\draw (3,-2.6) arc(270:90:0.6 and 1.3);
\draw (8,-2.6) arc(270:90:0.6 and 1.3);
\fill [color=gray!30,rotate around={90:(0,0)}] (-1.3,-14) ellipse (1.3cm and 0.6cm);
\draw [rotate around={90:(0,0)}] (-1.3,-14) ellipse (1.3cm and 0.6cm);
\draw [->,>=latex,color=blue] (3,-1.3) --++ (3,0)node [midway,above]{v};
\node at (8,-1.3) {S};
\node at (18,-1.3) {$ D=\dfrac{V}{\Delta t}=\dfrac{d\times S}{\Delta t}=\dfrac{v\times \Delta t\times S}{\Delta t}$};
\draw[color=blue] (19.5,-1.3) --++ (0.5,0.5);
\draw[color=blue] (19.5,-1.9) --++ (0.5,0.5);
\end{tikzpicture}
%Fin débit à travers un tuyau
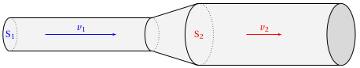
%Conservation du débit
\begin{tikzpicture}[scale=0.9]
\fill [color=gray!10] (0,0)rectangle(14,-1.4);
\fill [color=gray!10] (8,0.6)rectangle(14,-2);
\fill[color=gray!10] (6,0) --++ (2,0.6) --++ (0,-0.6) -- cycle;
\fill[color=gray!10] (6,-1.4) --++ (2,-0.6) --++ (0,0.6) -- cycle;
\fill [color=gray!10,rotate around={90:(0,0)}] (-0.7,0) ellipse (0.7cm and 0.3cm);
\draw (0,0) --++ (6,0) --++ (1.92,0.6) --++ (6,0);
\draw (0,-1.4) --++ (6,0) --++ (1.92,-0.6) --++ (6,0);
\draw [dotted] (0,-1.4) arc(-90:90:0.3 and 0.7);
\draw [dotted] (6,-1.4) arc(-90:90:0.3 and 0.7);
\draw [dotted] (8,-2) arc(-90:90:0.6 and 1.3);
\draw (0,-1.4) arc(270:90:0.3 and 0.7);
\draw (6,-1.4) arc(270:90:0.3 and 0.7);
\draw (8,-2) arc(270:90:0.6 and 1.3);
\fill [color=gray!30,rotate around={90:(0,0)}] (-0.7,-14) ellipse (1.3cm and 0.6cm);
\draw [rotate around={90:(0,0)}] (-0.7,-14) ellipse (1.3cm and 0.6cm);
\draw [->,>=latex,color=blue] (1.5,-0.7) --++ (3,0)node [midway,above]{$v_{1}$};
\node [color=blue] at (0,-0.7) {$S_{1}$};
\draw [->,>=latex,color=red] (10,-0.7) --++ (1.5,0)node [midway,above]{$v_{2}$};
\node [color=red] at (8,-0.7) {$S_{2}$};
\end{tikzpicture}
%Fin conservation du débit
Son
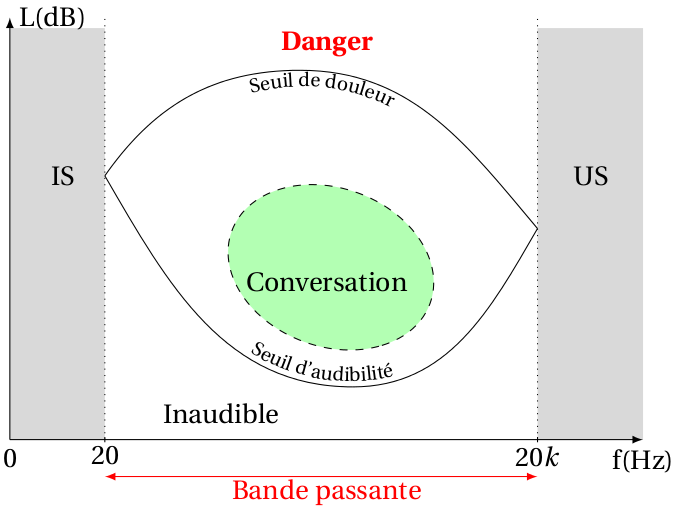 |
\begin{tikzpicture}[scale=0.7]
%Audiogramme
\fill [color=gray!30] (0,0) rectangle (1.8,7.8);
\fill[color=gray!30] (12,7.8) rectangle (10,0);
\node at (11,5) {US};
\node at (1,5) {IS};
\draw [->,>=latex] (0,0) --++(0,8) node [right] {L(dB)};
\draw [->,>=latex] (0,0) --++(12,0) node [below] {f(Hz)};
\node (O) at (0,0) [below] {0};
\draw (1.8,5) to[out=55,in=180] (5.5,7);
\draw (1.8,5) to[out=-60,in=180] (6.5,1);
\draw (5.5,7) to[out=0,in=130] (10,4);
\draw (6.5,1) to[out=0,in=-120] (10,4);
\begin{scope}[rotate around={-20:(5,2)}]
\draw [dashed,fill=green!30](7,2.5) arc (-45:315:2cm and 1.5cm);
\end{scope}
\draw[dotted] (1.8,0) --++ (0,8);
\draw[dotted] (10,0) --++ (0,8);
\draw(1.8,-0.05) --++ (0,0.1) node [below]{$ 20$};
\draw(10,-0.05) --++ (0,0.1) node [below]{$ 20k$};
\draw[<->,>=latex,color=red](1.8,-0.7) --++ (8.2,0);
\node at (6,-1) [color=red] {Bande passante};
\node at (6,3) {Conversation};
\node at (4,0.5) {Inaudible};
\node at (6,7.5) {\textbf{\textcolor{red}{Danger}}};
\draw[draw=white,double=white,postaction={decoration={text along path,text align=center,text=|\footnotesize| Seuil de douleur},decorate}] { (3.7,6.2) arc (120:50:3.7) } ;\draw[draw=none,postaction={decoration={text along path,text align=center,text=|\footnotesize| Seuil d'audibilit{\'e}},decorate}] { (3.7,2.4) arc (-140:-60:3.6) } ;
\end{tikzpicture}
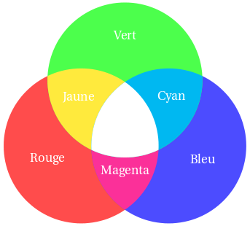
Optique
 |
 |
\begin{tikzpicture}[scale=1] \def\r{2.5};%rayon des cercles \newcommand{\R}{(0,0) ++(135:2) circle ({\r})}%rouge \newcommand{\B}{(0,0) ++(45:2) circle ({\r})}%bleu \newcommand{\V}{(0,0) ++(90:3.54) circle ({\r})}%vert \fill[color=red!70]\R;%disque rouge \fill[color=blue!70]\B;%disque bleu \fill[color=green!70]\V;%disque vert \begin{scope}%intersection bleu et rouge \clip \B; \fill[color=magenta] \R; \end{scope} \begin{scope}%intersection vert et rouge \clip \R; \fill[color=yellow] \V; \end{scope} \begin{scope}%intersection bleu et vert \clip \B; \fill[color=cyan] \V; \end{scope}; \begin{scope}%blanc \clip \B; \clip \R; \fill[white] \V; \end{scope} \node[color=white] at (2.5,1){Bleu}; \node[color=white] at (-2.5,1){Rouge}; \node[color=white] at (0,5){Vert}; \node[color=white] at (1.5,3){Cyan}; \node[color=white] at (-1.5,3){Jaune}; \node[color=white] at (0,0.6){Magenta}; \end{tikzpicture}
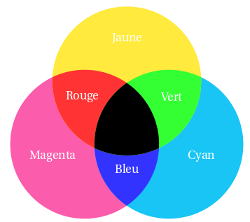
\begin{tikzpicture}[scale=1] \def\r{2.5};%rayon des cercles \newcommand{\M}{(0,0) ++(135:2) circle ({\r})}%magenta \newcommand{\C}{(0,0) ++(45:2) circle ({\r})}%cyan \newcommand{\J}{(0,0) ++(90:3.54) circle ({\r})}%jaune \fill[color=magenta!80]\M;%disque magenta \fill[color=cyan!80]\C;%disque cyan \fill[color=yellow]\J;%disque jaune \begin{scope}%intersection cyan et magenta \clip \M; \fill[color=blue!80] \C; \end{scope} \begin{scope}%intersection magenta et jaune \clip \M; \fill[color=red!80] \J; \end{scope} \begin{scope}%intersection jaune et cyan \clip \J; \fill[color=green!80] \C; \end{scope}; \begin{scope}%blanc \clip \M; \clip \J; \fill[black] \C; \end{scope} \node[color=white] at (2.5,1){Cyan}; \node[color=white] at (-2.5,1){Magenta}; \node[color=white] at (0,5){Jaune}; \node[color=white] at (1.5,3){Vert}; \node[color=white] at (-1.5,3){Rouge}; \node[color=white] at (0,0.6){Bleu}; \node at (0,-1.5){Synthèse soustractive}; \end{tikzpicture}
 |
 |
 |
\begin{tikzpicture}[scale=1]
%simple flèche
\tikzstyle simple=[postaction={decorate,decoration={markings, mark=at position .5 with {\arrow[scale=1,>=stealth]{>}}}}]
%simple flèche inversée
\tikzstyle simpleinverse=[postaction={decorate,decoration={markings, mark=at position .5 with {\arrow[scale=1,>=stealth]{<}}}}]
% radius, two angles, node attribute/name
\newcommand{\drawarc}[7]
{
\draw[->,>=latex] (#1,#2) arc(#3:#4:#5);
\draw({(#3+#4)/2}:#5) node[#6]{#7};
}
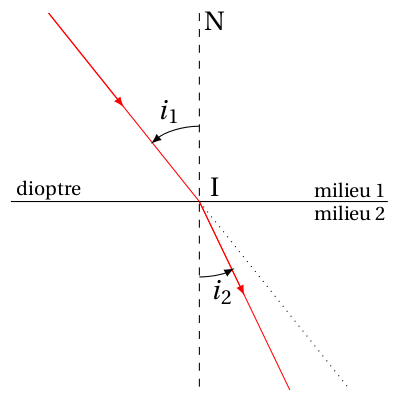
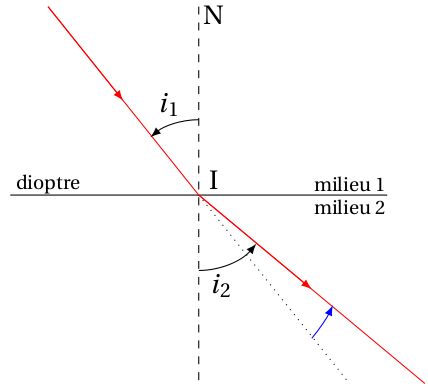
\draw (-2.5,0) --++ (5,0);%dioptre
\coordinate (I) at (0,0);%point d'incidence
\def \i{40}; %angle d'incidence en degré
\def \r{30}; %angle de réfraction en degré
\node at (-2,0.15) {\footnotesize dioptre};
\node at (2,0.15) {\footnotesize milieu 1};
\node at (2,-0.15) {\footnotesize milieu 2};
\node at (0.2,2.4) {N};
\node [above right]at (I) {I};
\draw [dashed] (0,2.5) --++ (0,-5);
\draw [color=red,simpleinverse] (I)--++(90+\i:2.5);%rayon incident
\draw [color=red,simple] (I) --++ (\r-90:2.5);%rayon réfracté
\draw [dotted] (I) --++ (\i-90:2.5);%ligne droite
\drawarc{0}{1}{90}{90+\i}{1}{above}{$i_1$};%angle d'incidence
\drawarc{0}{-1}{-90}{\r-90}{1}{above}{$i_2$};%angle de réfraction
\end{tikzpicture}
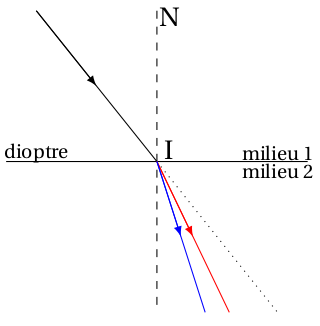
\begin{tikzpicture}[scale=1]
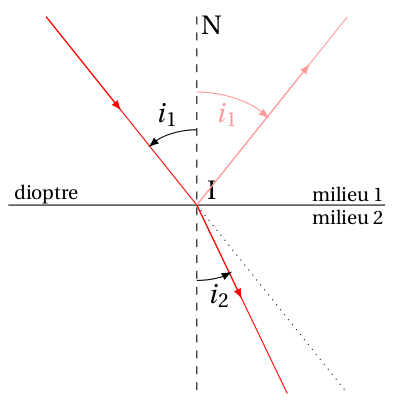
\draw (0,0) --+ (5,0);
\node at (0.5,0.15) {\footnotesize dioptre};
\node at (4.5,0.15) {\footnotesize milieu 1};
\node at (4.5,-0.15) {\footnotesize milieu 2};
\node at (2.7,2.4) {N};
\node at (2.7,0.2) {I};
\draw [dashed] (2.5,2.5) --+ (0,-5);
\draw [color=red] (0.5,2.5) --+ (2,-2.5);
\draw [color=red] (2.5,0) --+ (3,-2.5);
\draw [dotted] (2.5,0) --+ (2,-2.5);
\draw [->,>=latex,color=red] (0.5,2.5) --+ (1,-1.25);
\draw [->,>=latex,color=red] (2.5,0) --+ (1.5,-1.25);
\draw [->,>=latex] (2.5,1) arc (90:130:1);
\node () at (2.1,1.2) {$i_1$};
\draw [->,>=latex] (2.5,-1) arc (-90:-40:1);
\node () at (2.8,-1.2) {$i_2$};
\draw [->,>=latex,color=blue] (4,-1.9) arc (-40:-25:2);
\end{tikzpicture}
\begin{tikzpicture}[scale=1]
%simple flèche
\tikzstyle simple=[postaction={decorate,decoration={markings, mark=at position .5 with {\arrow[scale=1,>=stealth]{>}}}}]
%simple flèche inversée
\tikzstyle simpleinverse=[postaction={decorate,decoration={markings, mark=at position .5 with {\arrow[scale=1,>=stealth]{<}}}}]
% radius, two angles, node attribute/name
\newcommand{\drawarc}[7]
{
\draw[->,>=latex] (#1,#2) arc(#3:#4:#5);
\draw({(#3+#4)/2}:#5) node[#6]{#7};
}
\draw (-2.5,0) --++ (5,0);%dioptre
\coordinate (I) at (0,0);%point d'incidence
\def \i{40}; %angle d'incidence en degré
\def \r{30}; %angle de réfraction en degré
\node at (-2,0.15) {\footnotesize dioptre};
\node at (2,0.15) {\footnotesize milieu 1};
\node at (2,-0.15) {\footnotesize milieu 2};
\node at (0.2,2.4) {N};
\node [above right]at (I) {I};
\draw [dashed] (0,2.5) --++ (0,-5);
\draw [color=red,simpleinverse] (I)--++(90+\i:2.5);%rayon incident
\draw [color=red,simple] (I) --++ (\r-90:2.5);%rayon réfracté
\draw [color=red!40,simple] (I) --++ (90-\i:2.5);%rayon réfléchi
\draw [dotted] (I) --++ (\i-90:2.5);%ligne droite
\drawarc{0}{1}{90}{90+\i}{1}{above}{$i_1$};%angle d'incidence
\drawarc{0}{-1}{-90}{\r-90}{1}{above}{$i_2$};%angle de réfraction
\drawarc{0}{1.5}{90}{90-\i}{1.5}{above}{$i_1$};%angle de réflexion
\end{tikzpicture}
 |
\begin{tikzpicture}[scale=1]
%fibre optique
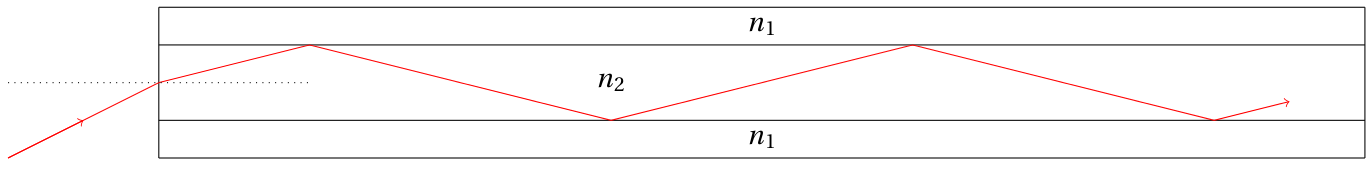
\draw (0,0) --+ (16,0);
\draw (0,-0.5) --+ (16,0);
\draw (0,-1.5) --+ (16,0);
\draw (0,-2) --+ (16,0);
\draw (0,0) --+ (0,-2);
\draw (16,0) --+ (0,-2);
\draw [->,color=red] (0,-1) --++ (2,0.5) --++ (4,-1) --++ (4,1) --++ (4,-1) --++ (1,0.25);
\draw [color=red] (0,-1) --++ (-2,-1);
\draw [->,color=red] (-2,-2) --++ (1,0.5);
\node at (8,-0.25) {$n_1$};
\node at (8,-1.75) {$n_1$};
\node at (6,-1) {$n_2$};
\draw [dotted](-2,-1)--++(4,0);
\end{tikzpicture}
 |
 |
\begin{tikzpicture}[scale=1]
%Cas limite
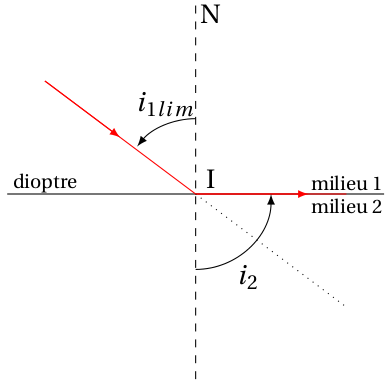
\draw (0,0) --+ (5,0);
\node at (0.5,0.15) {\footnotesize dioptre};
\node at (4.5,0.15) {\footnotesize milieu 1};
\node at (4.5,-0.15) {\footnotesize milieu 2};
\node at (2.7,2.4) {N};
\node at (2.7,0.2) {I};
\draw [dashed] (2.5,2.5) --+ (0,-5);
\draw [color=red] (0.5,1.5) --+ (2,-1.5);
\draw [color=red] (2.5,0) --+ (2,0);
\draw [dotted] (2.5,0) --+ (2,-1.5);
\draw [->,>=latex,color=red] (0.5,1.5) --+ (1,-0.75);
\draw [->,>=latex,color=red] (2.5,0) --+ (1.5,0);
\draw [->,>=latex] (2.5,1) arc (90:141:1);
\node () at (2.1,1.2) {$i_{1lim}$};
\draw [->,>=latex] (2.5,-1) arc (-90:0:1);
\node () at (3.2,-1.1) {$i_2$};
\end{tikzpicture}
\begin{tikzpicture}[scale=0.8]
%dispersion
\draw (0,0) --+ (5,0);
\node at (0.5,0.15) {\footnotesize dioptre};
\node at (4.5,0.15) {\footnotesize milieu 1};
\node at (4.5,-0.15) {\footnotesize milieu 2};
\node at (2.7,2.4) {N};
\node at (2.7,0.2) {I};
\draw [dashed] (2.5,2.5) --+ (0,-5);
\draw [] (0.5,2.5) --+ (2,-2.5);
\draw [color=red] (2.5,0) --+ (1.2,-2.5);
\draw [dotted] (2.5,0) --+ (2,-2.5);
\draw [->,>=latex] (0.5,2.5) --+ (1,-1.25);
\draw [->,>=latex,color=red] (2.5,0) --+ (0.6,-1.25);
\draw [color=blue] (2.5,0) --+ (0.8,-2.5);
\draw [->,>=latex,color=blue] (2.5,0) --+ (0.4,-1.25);
\end{tikzpicture}
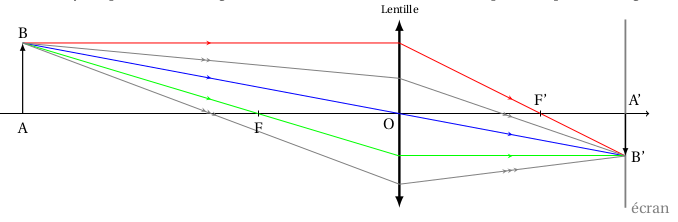 |
\begin{tikzpicture}[scale=1.1]
%simple flèche
\tikzstyle simple=[postaction={decorate,decoration={markings, mark=at position .5 with {\arrow[scale=1,>=stealth]{>}}}}]
%double flèches
\tikzstyle double=[postaction={decorate,decoration={markings, mark=at position .5 with {\arrow[scale=1,>=stealth]{>>}}}}]
%triple flèches
\tikzstyle triple=[postaction={decorate,decoration={markings, mark=at position .5 with {\arrow[scale=1,>=stealth]{>>}\arrow[scale=1,xshift=0.14cm,>=stealth]{>}}}}]
%paramètres modifiables
\def \taillehaut{2}; %taille de la lentille
\def \taillebas{2};%taille de la lentille
\def \tailleob{1.5};%hauteur de l'objet
\def \xA{-8};%position de l'objet
\def \f{3};%focale de la lentille
%fin paramètres modifiables
%calculs
\def \xAA {(\xA*\f)/(\xA+\f)};%position de l'image
\def \tailleim{(\xAA*\tailleob)/\xA};%hauteur de l'image
%fin calculs
\coordinate (O1) at (0,0);%centre optique de la lentille
\coordinate (B) at (\xA,\tailleob);%position de l'objet
\coordinate (F') at (\f,0);
\coordinate (A') at ({\xAA},0);
\coordinate (B') at ({\xAA},{\tailleim});%position de l'image
\draw [thick,->,>=latex](\xA,0)--++(0,{\tailleob}) node [above]{B};%objet
\node at (\xA,-0.3){A};
\draw[thin,->]({\xA-0.5},0)--({\xAA+0.5},0);%tracé de l'axe optique
\draw[shift={(O1)},ultra thick ,<->,>=latex] (0,-\taillebas)--(0,\taillehaut) node[above]{\scriptsize Lentille};%lentille convergente
\draw[,red,simple] (B)--(0,{\tailleob});%rayon parallele à l'axe optique
\draw[,red,simple] (0,{\tailleob})--(B');
\draw[,blue,simple] (B)--(O1);%rayon passant passant par le centre de la lentille
\draw[blue,simple] (O1)--(B');
\draw[green,simple] (B)--(0,{\tailleim});%rayon passant passant par le foyer objet
\draw[green,simple] (0,{\tailleim})--(B');
\draw[gray,double] (B)--(0,{\tailleob/2});
\draw[gray,double] (0,{\tailleob/2})--(B');
\draw[gray,triple] (B)--(0,{-\tailleob});
\draw[gray,triple] (0,{-\tailleob})--(B');
\draw[gray,very thick]({\xAA},{\taillehaut})--({\xAA},{-\taillebas})node[right]{écran};%écran
\draw [thick,->,>=latex](A')--++(0,{\tailleim}) node [below,right]{B'};%image
\node at ({\xAA+0.2},0.3){A'};
\foreach \x/\z in {O1/\f}{
\draw[shift={(\x)}] (0,0) node[below left] { O};
\draw[shift={(\x)}] (\z,-2pt) --++ (0,4pt) node[above] {F'};
\draw[shift={(\x)}] ({-\z},2pt) --++ (0,-4pt) node[below] {F};
}
\end{tikzpicture}
 |
 |
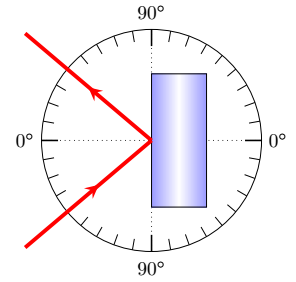
\begin{tikzpicture}[scale=1]
%simple flèche
\tikzstyle simple=[postaction={decorate,decoration={markings, mark=at position .5 with {\arrow[scale=1,>=stealth]{>}}}}]
%simple flèches inverse
\tikzstyle simpleinv=[postaction={decorate,decoration={markings, mark=at position .5 with {\arrow[scale=1,>=stealth]{<}}}}]
\def \rayon{2}; %rayon du disque gradué
\def \i{40}; %angle d'incidence
\def \r{25.4}; %angle de réfraction
\draw (0,0) circle (\rayon);
\foreach \y in {10,20,...,360} \draw({\rayon*cos(\y)},{\rayon*sin(\y)})--++(\y:-0.2);
\foreach \y in {0,90,...,270} \draw[thick]({\rayon*cos(\y)},{\rayon*sin(\y)})--++(\y:-0.3);
\draw[dotted](0,\rayon)--++(0,-2*\rayon);
\draw[dotted](-\rayon,0)--++(2*\rayon,0);
\draw [left color=blue!40,right color=blue!40,middle color=white] (0,1.2) rectangle (1,-1.2);
\draw [color=red,simpleinv,line width=2pt] (0,0) --++ (-180+\i:\rayon+1);
\node at (\rayon+0.3,0){$0^{\circ}$};
\node at (-\rayon-0.3,0){$0^{\circ}$};
\node at (0,\rayon+0.3){$90^{\circ}$};
\node at (0,-\rayon-0.3){$90^{\circ}$};
\draw [color=red,simple,line width=2pt] (0,0) --++ (180-\i:\rayon+1);
\end{tikzpicture}
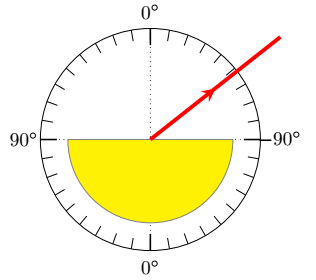
\begin{tikzpicture}[scale=1]
%simple flèche
\tikzstyle simple=[postaction={decorate,decoration={markings, mark=at position .5 with {\arrow[scale=1,>=stealth]{>}}}}]
%simple flèches inverse
\tikzstyle simpleinv=[postaction={decorate,decoration={markings, mark=at position .5 with {\arrow[scale=1,>=stealth]{<}}}}]
\def \rayon{2}; %rayon du disque gradué
\def \i{40}; %angle d'incidence
\def \r{25.4}; %angle de réfraction
\draw (0,0) circle (\rayon);
\foreach \y in {10,20,...,360} \draw({\rayon*cos(\y)},{\rayon*sin(\y)})--++(\y:-0.2);
\foreach \y in {0,90,...,270} \draw[thick]({\rayon*cos(\y)},{\rayon*sin(\y)})--++(\y:-0.3);
\draw[dotted](0,\rayon)--++(0,-2*\rayon);
\draw[dotted](-\rayon,0)--++(2*\rayon,0);
\draw [color=gray,fill=yellow] (0,0) --++({\rayon-0.5},0)arc(0:-180:{\rayon-0.5})--cycle;%Hémicylindre
\draw [color=red,simpleinv,line width=2pt] (0,0) --++ (180-\i:\rayon+1);
\node at (\rayon+0.35,0){$-90^{\circ}$};
\node at (-\rayon-0.3,0){$90^{\circ}$};
\node at (0,\rayon+0.3){$0^{\circ}$};
\node at (0,-\rayon-0.3){$0^{\circ}$};
\draw [color=red,simple,line width=2pt] (0,0) --++ (\i:\rayon+1);
\draw [color=red,simple,line width=2pt] (0,0) --++ (-90+\r:\rayon+1);
\end{tikzpicture}
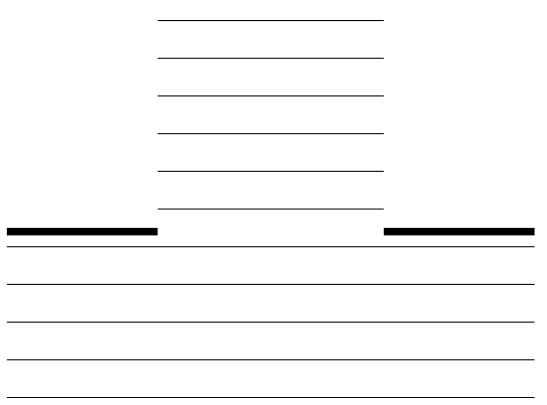
Ondes
 |
 |
\begin{tikzpicture}[scale=0.1]
%large ouverture
\draw [line width=0.1cm] (0,0) -- (20,0);
\draw [line width=0.1cm] (50,0) -- (70,0);
\foreach \x in {-2,-7,...,-22} \draw (0,\x) -- (70,\x);
\foreach \x in {3,8,...,28} \draw (20,\x) -- (50,\x);
%fin large ouverture
\end{tikzpicture}
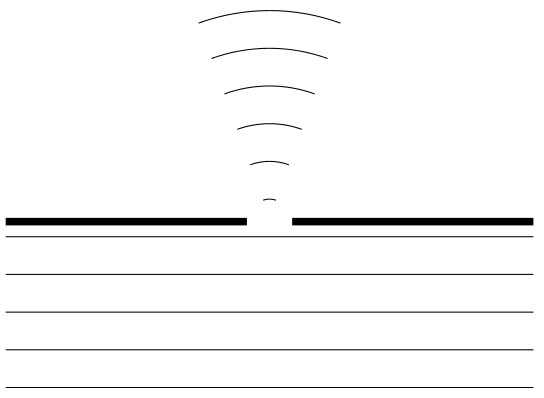
\begin{tikzpicture}[scale=0.1]
%petite ouverture
\draw [line width=0.1cm] (0,0) -- (32,0);
\draw [line width=0.1cm] (38,0) -- (70,0);
\foreach \x in {-2,-7,...,-22} \draw (0,\x) -- (70,\x);
\foreach \x in {3,8,...,28} \draw (35,\x) arc (90:70:\x-0.5);
\foreach \x in {3,8,...,28} \draw (35,\x) arc (90:110:\x-0.5);
%fin petite ouverture
\end{tikzpicture}
 |
 |
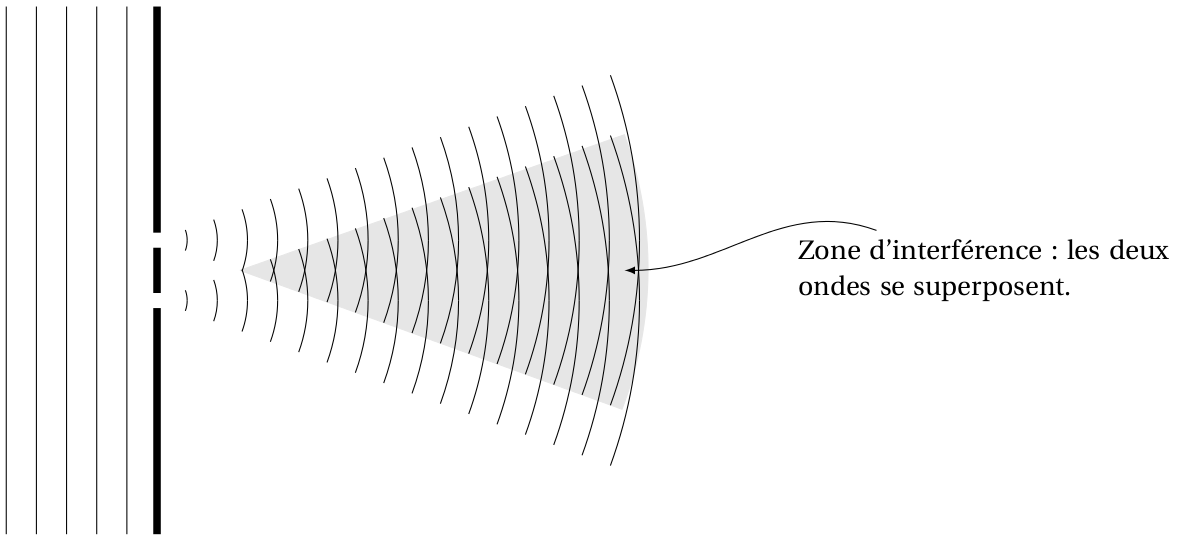
\begin{tikzpicture}[scale=0.1]
%Zone d'interférence
\draw [line width=0.1cm] (0,70) -- (0,40);
\draw [line width=0.1cm] (0,38) -- (0,32);
\draw [line width=0.1cm] (0,30) -- (0,0);
\foreach \x in {-4,-8,...,-20} \draw (\x,70) -- (\x,0) ;
\filldraw [color=gray!20] (11,35) -- (62,53) arc (20:-21:52) -- (11,35);
\foreach \x in {4,8,...,64} \draw ({\x*cos(20)},{39-\x*sin(20)}) arc (-20:20:\x) ;
\foreach \x in {4,8,...,64} \draw ({\x*cos(20)},{31-\x*sin(20)}) arc (-20:20:\x);
\node[text width=5cm] (I) at (110,35) {Zone d'interférence : les deux ondes se superposent.};
\draw[->,>=latex] (I) to[out=160,in=0] (62,35);
\end{tikzpicture}
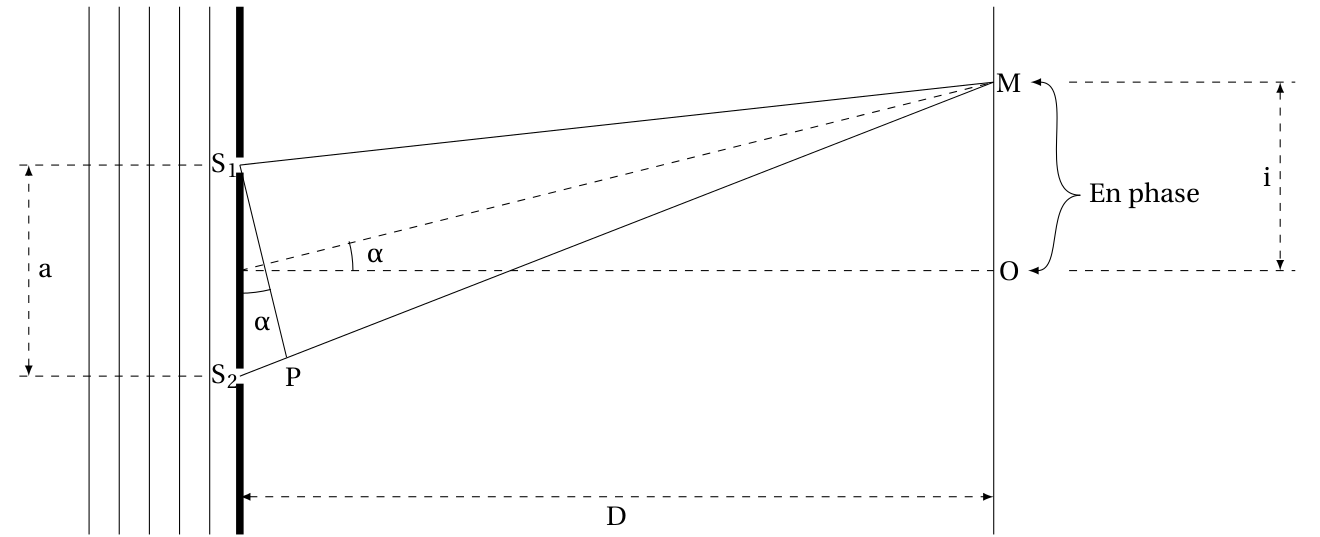
\begin{tikzpicture}[scale=0.1]
\node [] () at (-2,49) {$S_1$};
\node [] () at (-2,21) {$S_2$};
\node [] (O) at (102,60) {$M$};
\node [] (M) at (102,35) {$O$};
\node [] () at (7,21) {P};
\draw [line width=0.1cm] (0,70) -- (0,50);
\draw [line width=0.1cm] (0,48) -- (0,22);
\draw [line width=0.1cm] (0,20) -- (0,0);
\foreach \x in {-4,-8,...,-20} \draw (\x,70) -- (\x,0) ;
\draw [] (100,70) -- (100,0);
\draw [] (0,49) -- (100,60);
\draw [] (0,21) -- (100,60);
\draw (15,35) arc (0:15:15);
\node at (18,37) {$\alpha$};
\draw (0,32) arc (-90:-76:17);
\node at (3,28) {$\alpha$};
\draw [dashed] (0,35) -- (100,60);
\draw [dashed] (0,35) -- (100,35);
\draw [dashed] (-5,49) -- (-30,49);
\draw [dashed] (-5,21) -- (-30,21);
\draw [dashed,<->,>=latex] (-28,21) -- (-28,49) node [right,midway] {a};
\draw [dashed] (110,60) -- (140,60);
\draw [dashed] (110,35) -- (140,35);
\draw [dashed,<->,>=latex] (138,60) -- (138,35) node [left,midway] {i};
\draw [dashed,<->,>=latex] (0,5) -- (100,5) node [below,midway] {D};
\draw [] (0,49) -- (6.2,23.5);
\node [] (E) at (120,45) {En phase};
\draw[->,>=latex] (E) to[out=180,in=0] (O);
\draw[->,>=latex] (E) to[out=180,in=0] (M);
\end{tikzpicture}
Mouvement
 |
 |
 |
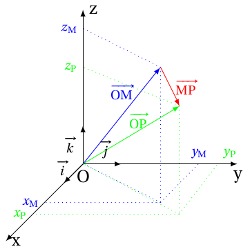
%Vecteur position
\begin{tikzpicture}[scale=0.8]
\draw [->,>=latex] (0,0) --++(0,4) node [right] {z};
\draw [->,>=latex] (0,0) --++(-2,-2) node [right] {x};
\draw [->,>=latex] (0,0) --++(4,0) node [below] {y};
\draw [->,>=latex] (0,0) --++(0,1) node [right] {};
\draw [->,>=latex] (0,0) --++(-0.5,-0.5) node [right] {};
\draw [->,>=latex] (0,0) --++(1,0) node [below] {};
\node (O) at (0,0) [below] {O};
\draw [->,>=latex,color=blue] (0,0) -- (2,2.5) node [left,near end] {$ \scriptstyle \vec{OM}$};
\draw [dotted] (2,2.5) -- (2,-1);
\draw [dotted] (2,-1) -- (0,0);
\draw [dotted] (2,-1) -- (3,0);
\draw [dotted] (2,-1) -- (-1,-1);
\draw [dotted] (2,2.5) -- (0,3.5);
\node (xM) at (-1,-1) [left] {$\scriptstyle x_{M}$};
\node (yM) at (3,0) [above] {$\scriptstyle y_{M}$};
\node (zM) at (0,3.5) [left] {$\scriptstyle z_{M}$};
\node (i) at (-0.2,-0.1) [left] {$\scriptstyle \vec{i}$};
\node (j) at (0.6,0) [above] {$\scriptstyle \vec{j}$};
\node (k) at (0,0.5) [left] {$\scriptstyle \vec{k}$};
\end{tikzpicture}
%fin Vecteur position
%Vecteur déplacement
\begin{tikzpicture}[scale=0.8]
\draw [->,>=latex] (0,0) --++(0,4) node [right] {z};
\draw [->,>=latex] (0,0) --++(-2,-2) node [right] {x};
\draw [->,>=latex] (0,0) --++(4,0) node [below] {y};
\draw [->,>=latex] (0,0) --++(0,1) node [right] {};
\draw [->,>=latex] (0,0) --++(-0.5,-0.5) node [right] {};
\draw [->,>=latex] (0,0) --++(1,0) node [below] {};
\node (O) at (0,0) [below] {O};
\draw [->,>=latex,color=blue] (0,0) -- (2,2.5) node [left,near end] {$ \scriptstyle \vec{OM}$};
\draw [dotted,color=blue] (2,2.5) -- (2,-1);
\draw [dotted,color=blue] (2,-1) -- (0,0);
\draw [dotted,color=blue] (2,-1) -- (3,0);
\draw [dotted,color=blue] (2,-1) -- (-1,-1);
\draw [dotted,color=blue] (2,2.5) -- (0,3.5);
\node (xM) at (-1,-1) [left,color=blue] {$\scriptstyle x_{M}$};
\node (yM) at (3,0) [above,color=blue] {$\scriptstyle y_{M}$};
\node (zM) at (0,3.5) [left,color=blue] {$\scriptstyle z_{M}$};
\draw [->,>=latex,color=green] (0,0) -- (2.5,1.5) node [left,near end] {$ \scriptstyle \vec{OP}$};
\draw [dotted,color=green] (2.5,1.5) -- (2.5,-1.3);
\draw [dotted,color=green] (2.5,-1.3) -- (0,0);
\draw [dotted,color=green] (2.5,-1.3) -- (3.5,0);
\draw [dotted,color=green] (2.5,-1.3) -- (-1.3,-1.3);
\draw [dotted,color=green] (2.5,1.5) -- (0,2.5);
\node (xM) at (-1.3,-1.3) [left,color=green] {$\scriptstyle x_{P}$};
\node (yM) at (3.8,0) [above,color=green] {$\scriptstyle y_{P}$};
\node (zM) at (0,2.5) [left,color=green] {$\scriptstyle z_{P}$};
\node (i) at (-0.2,-0.1) [left] {$\scriptstyle \vec{i}$};
\node (j) at (0.6,0) [above] {$\scriptstyle \vec{j}$};
\node (k) at (0,0.5) [left] {$\scriptstyle \vec{k}$};
\draw [->,>=latex,color=red] (2,2.5) -- (2.5,1.5) node [right,midway] {$ \scriptstyle \vec{MP}$};
\end{tikzpicture}
%fin Vecteur déplacement
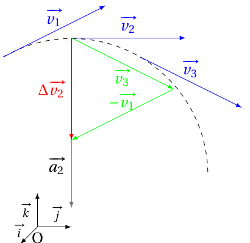
%vecteurs variation de vitesse et accélération
\begin{tikzpicture}[scale=0.8]
\draw [->,>=latex] (0,0) --++(0,1) node [right] {};
\draw [->,>=latex] (0,0) --++(-0.5,-0.5) node [right] {};
\draw [->,>=latex] (0,0) --++(1,0) node [below] {};
\node (O) at (0,0) [below] {O};
\node (i) at (-0.2,-0.1) [left] {$\scriptstyle \vec{i}$};
\node (j) at (0.6,0) [above] {$\scriptstyle \vec{j}$};
\node (k) at (0,0.5) [left] {$\scriptstyle \vec{k}$};
\draw [dashed] (-1,5) arc (120:0:4);
\draw [->,>=latex,color=blue] (-1,5) --++(3,1.5) node [above,midway,color=blue] {$\vec{v_{1}}$};
\draw [->,>=latex,color=blue] (1,5.55) --++(3.35,0) node [above,midway,color=blue] {$\vec{v_{2}}$};
\draw [->,>=latex,color=blue] (3,5) --++(3,-1.5) node [above,midway,color=blue] {$\vec{v_{3}}$};
\draw [->,>=latex,color=green] (1,5.55) --++(3,-1.5) node [below,midway,color=green] {$\vec{v_{3}}$};
\draw [->,>=latex,color=green] (4,4.05) --++(-3,-1.5) node [above,midway,color=green] {$-\vec{v_{1}}$};
\draw [->,>=latex,color=red] (1,5.55) --++(0,-3) node [left,midway,color=red] {$\Delta \vec{v_{2}}$};
\draw [->,>=latex,opacity=0.5] (1,5.55) --++(0,-5) node [left,near end,opacity=1] {$ \vec{a_{2}}$};
\end{tikzpicture}
%fin vecteur variation de vitesse et accélération
 |
%mouvement rectiligne uniforme
\begin{tikzpicture}[scale=1.5]
\foreach \x in {0,1,...,10} \fill(\x,0) circle (0.05) node [below] {\x};
\foreach \x in {0,2,...,8} \draw [->,>=latex,color=blue](\x,0) --++ (0.7,0) node [above,midway] {$\vec{v_{\x}}$};
\end{tikzpicture}
%fin mouvement rectiligne uniforme
 |
%mouvement rectiligne accéléré
\begin{tikzpicture}[scale=1.5]
\foreach \x in {0,1,...,10} \fill(0.1*\x*\x,0) circle (0.05) node [below] {\x};
\foreach \x in {2,4,...,8} \draw [->,>=latex,color=blue](0.1*\x*\x,0) --++ (0.04*\x*\x,0) node [above,midway] {$\vec{v_{\x}}$};
\foreach \x in {1,3,...,9} \draw [->,>=latex,color=red](0.1*\x*\x,0) --++ (0.5,0) node [below,midway] {$\vec{a_{\x}}$};
\end{tikzpicture}
%fin mouvement rectiligne accéléré
 |
 |
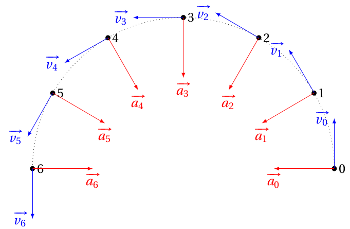
%mouvement circulaire uniforme
\begin{tikzpicture}[scale=1.4]
\foreach \x in {0,1,...,6} \fill({3*cos(30*\x)},{3*sin(30*\x)}) circle (0.05) node [below,right] {\x};
\foreach \x in {0,1,...,6} \draw [->,>=latex,color=blue] ({3*cos(30*\x)},{3*sin(30*\x)}) --++ ({sin(30*\x)*(-1)},{cos(30*\x)}) node [left] {$\vec{v_{\x}}$};
\foreach \x in {0,1,...,6} \draw [->,>=latex,color=red] ({3*cos(30*\x)},{3*sin(30*\x)}) --++ ({1.2*cos(30*\x)*(-1)},{1.2*sin(30*\x)*(-1)}) node [left,below] {$\vec{a_{\x}}$};
\draw [dotted] (3,0) arc (0:180:3);
\end{tikzpicture}
%fin mouvement circulaire uniforme
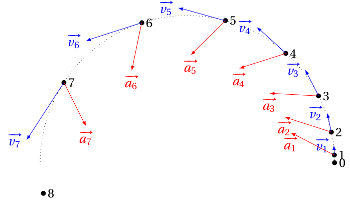
%mouvement circulaire accéléré
\begin{tikzpicture}[scale=1.4]
\foreach \x in {0,1,...,8} \fill({3*cos(3*\x*\x)},{3*sin(3*\x*\x)}) circle (0.05) node [below,right] {\x};
\foreach \x in {1,2,...,7} \draw [->,>=latex,color=blue] ({3*cos(3*\x*\x)},{3*sin(3*\x*\x)}) --++ ({0.2*\x*sin(3*\x*\x)*(-1)},{0.2*\x*cos(3*\x*\x)}) node [left] {$\vec{v_{\x}}$};
\foreach \x in {1,2,...,7} \draw [->,>=latex,color=red] ({3*cos(3*\x*\x)},{3*sin(3*\x*\x)}) --++ ({cos(3*\x*\x-30)*(-1)},{sin(3*\x*\x-30)*(-1)}) node [left,below] {$\vec{a_{\x}}$};
\draw [dotted] (3,0) arc (0:180:3);
\end{tikzpicture}
%fin mouvement circulaire accéléré
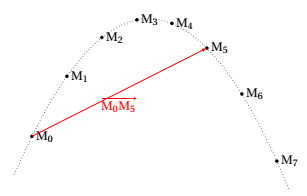 |
%mouvement parabolique \begin{tikzpicture}[scale=1] \clip(-0.5,-1.5) rectangle (8,4); \foreach \x in {0,1,...,7} \fill({\x},{0.3*\x*\x*(-1)+2*\x}) circle (0.05) node [below,right] {$M_{\x}$}; %\foreach \x in {1,2,...,7} \draw [->,>=latex,color=blue] ({3*cos(3*\x*\x)},{3*sin(3*\x*\x)}) --++ ({0.2*\x*sin(3*\x*\x)*(-1)},{0.2*\x*cos(3*\x*\x)}) node [left] {$\vec{v_{\x}}$}; %\draw [dotted] (3,0) arc (0:180:3); \draw[dotted,domain=-0.5:7.5] plot (\x,{0.3*\x*\x*(-1)+2*\x}); \draw[->,>=latex,color=red](0,0)--(5,2.5)node [midway,below]{$ \vec{M_0M_5}$}; \end{tikzpicture} %fin mouvement parabolique
Effet Doppler
 |
 |
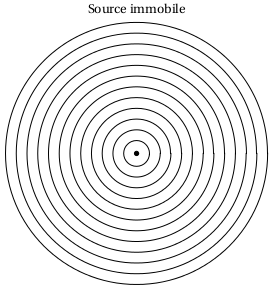
%Source immobile
\begin{tikzpicture}[scale=0.06]
\filldraw (0,0) circle (1);
\foreach \x in {6,11,...,61} \draw (0,0) circle (\x);
\end{tikzpicture}
%Fin Source immobile
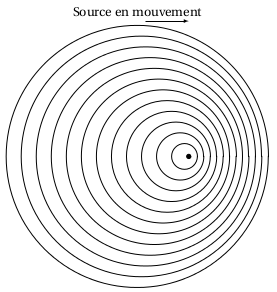
\begin{tikzpicture}[scale=0.06]
\draw[->,>=latex] (-20,63) -- (0,63);
\filldraw (0,0) circle (1);
\foreach \x in {1,2,...,12} \draw (-2*\x,0) circle (\x*5+1);
\end{tikzpicture}
 |
 |
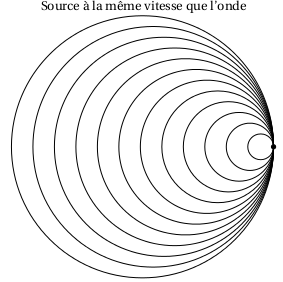
%mach1
\begin{tikzpicture}[scale=0.06]
\filldraw (0,0) circle (1);
\foreach \x in {1,2,...,12} \draw (-5*\x-1,0) circle (\x*5+1);
\end{tikzpicture}
%Fin mach1
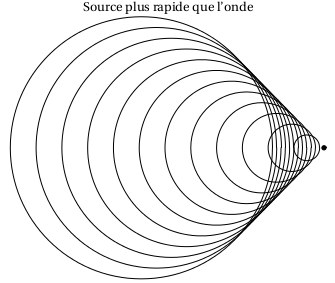
%Source plus rapide
\begin{tikzpicture}[scale=0.06]
\filldraw (0,0) circle (1);
\foreach \x in {1,2,...,12} \draw (-7*\x-1,0) circle (\x*5+1);
\end{tikzpicture}
%Fin Source plus rapide
Oscillateurs
 |
 |
 |
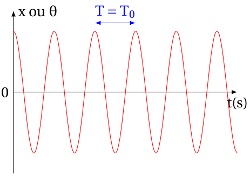
%Régime périodique
\begin{tikzpicture}[scale=1]
\draw [color=blue,<->,>=latex] (2,1.7) --++ (1,0)node [midway,above] {$ T=T_0$};
\draw [->,>=latex] (0,-2) --++(0,4) node [right] {x ou $ \theta$};
\draw [->,>=latex] (0,0) --++(5.5,0) node [below] {t(s)};
\node (O) at (0,0) [left] {0};
\draw[smooth,samples=100,domain=0:5.5,color=red] plot(\x,{1.5*cos(360*\x)});
\end{tikzpicture}
%Fin Régime périodique
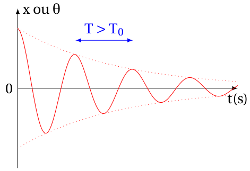
%Régime pseudo-périodique
\begin{tikzpicture}[scale=1]
\draw [color=blue,<->,>=latex] (1.44,1.2) --++ (1.44,0)node [midway,above] {$ T>T_0$};
\draw [->,>=latex] (0,-2) --++(0,4) node [right] {x ou $ \theta$};
\draw [->,>=latex] (0,0) --++(5.5,0) node [below] {t(s)};
\node (O) at (0,0) [left] {0};
\draw[smooth,samples=100,domain=0:5.5,color=red] plot(\x,{1.5*cos(250*\x)/(exp(\x/2.5))});
\draw[smooth,samples=100,domain=0:5.5,color=red,dotted] plot(\x,{1.5/(exp(\x/2.5))});
\draw[smooth,samples=100,domain=0:5.5,color=red,dotted] plot(\x,{1.5*(-1)/(exp(\x/2.5))});
\end{tikzpicture}
%Fin Régime pseudo-périodique
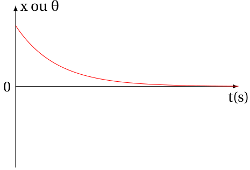
%Régime apériodique
\begin{tikzpicture}[scale=1]
\draw [->,>=latex] (0,-2) --++(0,4) node [right] {x ou $ \theta$};
\draw [->,>=latex] (0,0) --++(5.5,0) node [below] {t(s)};
\node (O) at (0,0) [left] {0};
\draw[smooth,samples=100,domain=0:5.5,color=red] plot(\x,{1.5/(exp(\x))});
\end{tikzpicture}
%Fin Régime apériodique
 |
 |
 |
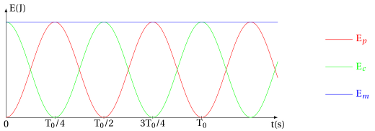
\begin{tikzpicture}[scale=1]
%Energie oscillateurs
\draw [->,>=latex] (0,0) --++(0,4) node [right] {E(J)};
\draw [->,>=latex] (0,0) --++(10,0) node [below] {t(s)};
\node (O) at (0,0) [below] {0};
\draw[smooth,samples=100,domain=0:10,color=red] plot(\x,{3.5*sin(50*\x)*sin(50*\x)});
\draw[smooth,samples=100,domain=0:10,color=green] plot(\x,{3.5*cos(50*\x)*cos(50*\x)});
\draw[smooth,samples=100,domain=0:10,color=blue] plot(\x,{3.5});
\draw(1.8,-0.05) --++ (0,0.1) node [below]{$ T_0/4$};
\draw(3.6,-0.05) --++ (0,0.1) node [below]{$ T_0/2$};
\draw(5.4,-0.05) --++ (0,0.1) node [below]{$ 3T_0/4$};
\draw(7.2,-0.05) --++ (0,0.1) node [below]{$ T_0$};
\begin{scope}[xshift=12cm]%Décalage horizontal de 12 cm
\draw [color=red] (0,0) --++ (1,0) node [right] {$ E_p$};
\draw [color=green] (0,-1) --++ (1,0) node [right] {$ E_c$};
\draw [color=blue] (0,-2) --++ (1,0) node [right] {$ E_m$};
\end{scope}
\end{tikzpicture}
%Fin Energie oscillateurs
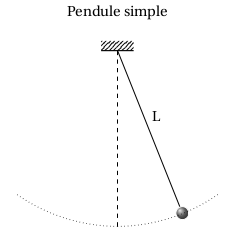
%Pendule simple
\begin{tikzpicture}[scale=0.8]
\draw (0,0)--++(-2,+5);
\node at (-0.8,3) {L};
\draw [rounded corners=4pt,color=white,ball color=gray,smooth] (0,0) circle (0.2);
\draw [dashed] (-2,-0.4)--++(0,5.4);
\draw [dotted] (-2,-0.4) arc (-90:-55:5.4);
\draw [dotted] (-2,-0.4) arc (-90:-125:5.4);
\fill [pattern=north east lines,rotate=0] (-2.5,5) rectangle (-1.5,5.3); %bloc qui tient le pendule
\draw[thick] (-2.5,5) --++ (1,0); %bloc qui tient le pendule
\end{tikzpicture}
%Fin Pendule simple
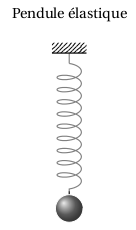
%Pendule élastique
\begin{tikzpicture} [scale=0.85, decoration={coil,aspect=0.4,segment length=3mm,amplitude=3mm}]
%decoration : gère l'aspect du ressort par l'instruction decorate
\tikzset{ressort/.style={thick,gray,smooth}} %définition d'un style de ressort
\draw[ressort,decorate] (0,-0.3)--(0,-4) ;
%bloc qui tient le ressort
\draw[thick,gray] (0,0) -- (0,-0.3); \fill [pattern=north east lines] (-0.5,0) rectangle (0.5,0.3); \draw[thick](-0.5,0)--(0.5,0); %fin ressort
\draw [thick](0,-4)--(0,-4.5);
\draw [rounded corners=4pt,color=white,ball color=gray,smooth] (0,-4.5) circle (0.4) ;
\end{tikzpicture}
%Fin Pendule élastique
Travail-Energie
 |
 |
 |
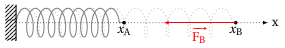
%schéma du ressort
\begin{tikzpicture}[scale=1, decoration={coil,aspect=0.4,segment length=3mm,amplitude=4mm}]
%decoration : gère l'aspect du ressort par l'instruction decorate
\tikzset{ressort/.style={thick,gray,smooth}}\draw[ressort,decorate,rotate=0] (0,0)--(3,0);
\tikzset{ressort/.style={thick,gray,smooth}}\draw[dotted,opacity=0.5,ressort,decorate,segment length=6mm,rotate=0] (0,0)--(6.1,0);
\fill [pattern=north east lines,rotate=90] (-0.5,0) rectangle (0.5,0.3); %bloc qui tient le ressort
\draw[thick] (0,-0.5) -- (0,0.5); %bloc qui tient le ressort
\draw [->,>=latex,dotted](0,0) --++ (7,0) node [right]{x};
\fill (3,0) circle (0.05) node [below] {$ x_A$};
\fill (6.1,0) circle (0.05) node [below] {$ x_B$};
\draw[color=red,->,>=latex](6.1,0)--++(-2,0)node[below,midway]{$\vec{F_B}$};
%fin schéma du ressort
\end{tikzpicture}
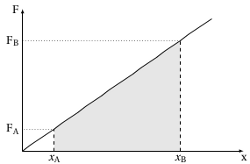
\begin{tikzpicture}[scale=1]
%f=kx
\fill[fill=gray!20](1,0) -- (1,0.7)-- plot [domain=1:5] (\x,0.7*\x)-- (5,0) -- cycle;
\draw[domain=0:6] plot (\x,0.7*\x);
\draw [->,>=latex] (0,0) --++(7,0) node [below] {x};
\draw [->,>=latex] (0,0) --++(0,4.5) node [left] {F};
\node [below] at (1,0) {$ x_A$};
\node [below] at (5,0) {$ x_B$};
\draw [dashed](1,0)--++(0,0.7);
\draw [dashed](5,0)--++(0,3.5);
\draw [dotted](1,0.7)--++(-1,0);
\draw [dotted](5,3.5)--++(-5,0);
\node [left] at (0,0.7) {$ F_A$};
\node [left] at (0,3.5) {$ F_B$};
%fin f=kx
\end{tikzpicture}
%travail du poids
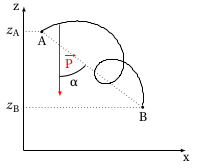
\begin{tikzpicture}[scale=1]
\draw [->,>=latex] (-2,-2) --++(4.5,0) node [below] {x};
\draw [->,>=latex] (-2,-2) --++(0,4) node [left] {z};
\draw[samples=200,domain=1.5:5] plot (100*\x:\x-3);
\fill [] (-1.5,1.3) circle (0.04) node [below] {A};
\fill [] (1.3,-0.8) circle (0.04) node [below] {B};
\draw [dotted] (-1.5,1.3) --++ (-0.5,0);
\draw [dotted] (1.3,-0.8) --++ (-3.3,0);
\draw [dotted] (-1.5,1.3) --++ (2.8,-2.1);
\node [left] at (-2,1.3) {$ z_A$};
\node [left] at (-2,-0.8) {$ z_B$};
\draw [->,>=latex,color=red](-1,1.5)--++(0,-2) node[midway,right] {$\vec{P}$};
\draw (-0.3,0.35) arc (-45:-90:1);
\node [below] at (-0.6,0.1) {$\alpha$}
;
\end{tikzpicture}
%fin travail du poids
 |
\begin{tikzpicture}
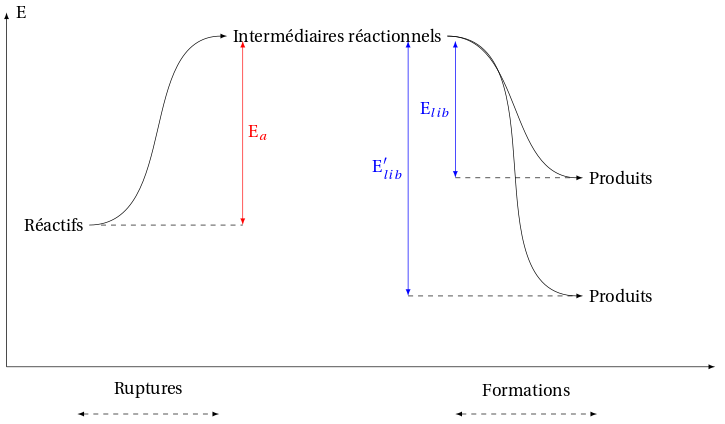
\node[] (R) at (0,0) {Réactifs};
\node[] (E) at (-0.7,4.5) {E};
\node[] () at (2,-3.5) {Ruptures};
\node[] (F) at (10,-3.5) {Formations};
\node[] (I) at (6,4) {Intermédiaires réactionnels};
\node[] (P) at (12,1) {Produits};
\node[] (Q) at (12,-1.5) {Produits};
\draw[->,>=latex] (R) to[out=0,in=180] (I);
\draw[->,>=latex] (I) to[out=0,in=180] (P);
\draw[->,>=latex] (I) to[out=0,in=180] (Q);
\draw [->,>=latex] (-1,-3) -- (-1,4.5);
\draw [color=red,<->,>=latex] (4,0) -- (4,3.9)node[midway,right]{$E_a$};
\draw [color=blue,<->,>=latex] (8.5,1) -- (8.5,3.9) node[midway,left]{$E_{lib}$} ;
\draw [color=blue,<->,>=latex] (7.5,-1.5) -- (7.5,3.9) node[midway,left]{$E'_{lib}$} ;
\draw [->,>=latex] (-1,-3) -- (14,-3);
\draw [dashed] (1,0) -- (4,0);
\draw [dashed] (8.5,1) -- (11,1);
\draw [dashed] (7.5,-1.5) -- (11,-1.5);
\draw [dashed,<->,>=latex] (0.5,-4) -- (3.5,-4);
\draw [dashed,<->,>=latex] (8.5,-4) -- (11.5,-4);
\end{tikzpicture}
Planètes et satellites
 |
 |
 |
\begin{tikzpicture}[line cap=round,line join=round,scale=0.15]
%Schema loi des aires
\newcommand{\E}{(23.5,35) ellipse (18cm and 12cm)}
\newcommand{\A}{(20,35)--++ (22,6) --++ (0,-8) -- cycle;}
\newcommand{\B}{(20,35)--++ (-15,9) --++ (0,-19) -- cycle;}
\clip(2,20) rectangle (48,50);
\begin{scope}
\clip \E;
\fill[color=gray!10] \A;
\draw[dotted] \A;
\end{scope}
\begin{scope}
\clip \E;
\fill[color=gray!20] \B;
\draw[dotted] \B;
\end{scope}
\draw [rotate around={0:(23.5,35)}] (23.5,35) ellipse (18cm and 12cm);
\fill [color=blue] (20,35) circle (1.5pt);
\fill [color=blue] (39.6,40.3) circle (0.3);
\fill [color=blue] (41.2,33) circle (0.3);
\fill [color=blue] (8.7,41.8) circle (0.3);
\fill [color=blue] (9.2,27.7) circle (0.3);
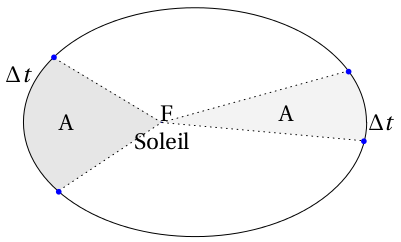
\draw[] (20.49,35.95) node {$F$};
\node () at (10,35) {A};
\node () at (33,36) {A};
\node () at (5,40) {$\Delta t$};
\node () at (43,35) {$\Delta t$};
\node () at (20,33) {Soleil};
%Fin schema loi des aires
\end{tikzpicture}
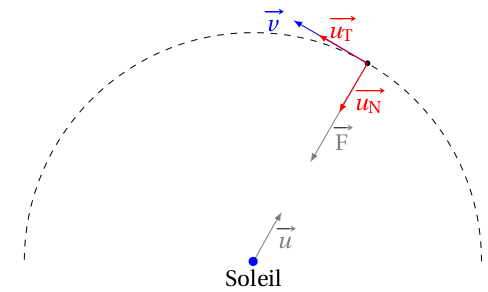
%base de Frenet
\begin{tikzpicture}[scale=0.9]
\draw [dashed] (4,0) arc (0:180:4);
\fill [color=blue] (0,0) circle (0.08) node [color=black,below] {Soleil};
\fill({4*cos(60)},{4*sin(60)}) circle (0.05);
\draw [->,>=latex,color=blue] ({4*cos(60)},{4*sin(60)}) --++ ({1.5*sin(60)*(-1)},{1.5*cos(60)}) node [left] {$\vec{v}$};
\draw [->,>=latex,opacity=0.5] ({4*cos(60)},{4*sin(60)}) --++ ({2*cos(60)*(-1)},{2*sin(60)*(-1)})node [right,near end] {$\vec{F}$};
\draw [->,>=latex,color=red] ({4*cos(60)},{4*sin(60)}) --++ ({1*cos(60)*(-1)},{1*sin(60)*(-1)})node [right,near end] {$\vec{u_{N}}$};
\draw [->,>=latex,opacity=0.5] (0,0) --++ ({1*cos(60)},{1*sin(60)})node [right,midway] {$\vec{u}$};
\draw [->,>=latex,color=red] ({4*cos(60)},{4*sin(60)}) --++ ({1*sin(60)*(-1)},{1*cos(60)}) node [above,midway] {$\vec{u_{T}}$};
\end{tikzpicture}
%fin base de Frenet
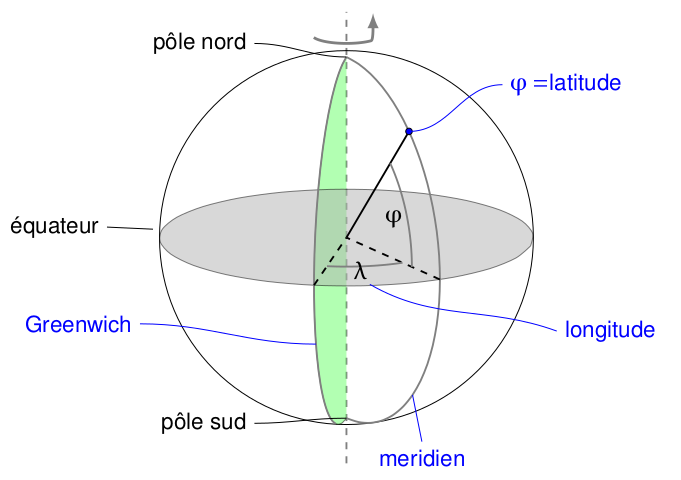
\tdplotsetmaincoords{105}{-10}%inclinaison de l'axe
\begin{tikzpicture}[tdplot_main_coords,font=\sffamily,line join=bevel,scale=0.7]
\pgfmathsetmacro{\R}{4} % rayon
\pgfmathsetmacro{\Lat}{48}% valeur de la latitude
\pgfmathsetmacro{\Lon}{50}% valeur de la longitude
\draw[thick,gray,dashed] (0,0,-\R-1) -- (0,0,\R+1);%axe nord sud
\draw[tdplot_screen_coords] (0,0) circle (\R);
% remplissage greenwich
\draw[fill=green!60,opacity=0.5] plot[variable=\x,domain=-90:90,smooth] (0,{\R*cos(\x)},{\R*sin(\x)});
% remplissage equateur
\draw[fill=gray!60,opacity=0.5] plot[variable=\x,domain=0:360,smooth] ({\R*cos(\x)},{\R*sin(\x)},0);
% N pole nord; S pole sud ; W ouest ; M
\path (0,0,\R) coordinate (N) (0,0,-\R) coordinate (S) (-\R,0,0) coordinate (W)({\R*cos(\Lon)*sin(135)},{\R*sin(\Lon)*sin(135)},{\R*cos(135)}) coordinate (M) (0,{\R*sin(110)},{\R*cos(110)}) coordinate (G);
\pgfmathsetmacro{\thetacrit}{atan(cos(\tdplotmaintheta)/(sin(\tdplotmaintheta)*sin(\Lon)))}
% Tracé du méridien passant par L
\draw[thick,gray] (N) plot[variable=\x,domain={180}:0,smooth] ({\R*cos(\Lon)*sin(\x)},{\R*sin(\Lon)*sin(\x)},{\R*cos(\x)}) ;
% Tracé du méridien Greenwich
\draw[thick,gray] (N) plot[variable=\x,domain={180+\thetacrit}:0,smooth] ({\R*cos(90)*sin(\x)},{\R*sin(90)*sin(\x)},{\R*cos(\x)}) ;
% Tracé du triangle ; L point
\draw[thick,dashed] ({\R*cos(\Lon)},{\R*sin(\Lon)},0)-- (0,0,0);
\draw[thick](0,0,0) -- ({\R*cos(\Lon)*cos(\Lat)},{\R*sin(\Lon)*cos(\Lat)},{\R*sin(\Lat)})
coordinate (L);
\draw[thick,dashed] ({\R*cos(90)},{\R*sin(90)},0)-- (0,0,0);
%arc latitude
\draw[thick,gray] plot[variable=\x,domain=90:90-\Lat,smooth] ({0.7*\R*cos(\Lon)*sin(\x)},{0.7*\R*sin(\Lon)*sin(\x)},{0.7*\R*cos(\x)});
%arc longitude
\draw[thick,gray] plot[variable=\x,domain=90:\Lon,smooth] ({0.6*\R*cos(\x)},{0.6*\R*sin(\x)},0);
\node [tdplot_screen_coords] at (1,0.4) {$\varphi$};
\node [tdplot_screen_coords] at (0.3,-0.7) {$\lambda$};
\draw[fill=blue] (L) circle (2pt);
\draw[->,>=latex,very thick,gray] plot[variable=\x,domain=150:30,smooth] ({cos(\x)*sin(\Lat)},{sin(\x)*sin(\Lat)},{\R+0.5});% fleche rotation
%%Textes
\draw[blue,tdplot_screen_coords] (L) to[out=0,in=180] ++ (2,1) node[right]{$\varphi=$latitude};
\draw ([xshift=-2mm]W) -- ++ (-1,0) node[left]{équateur}
(N) to[out=180,in=0] ++ (-2,0.2cm) node[left]{pôle nord}
(S) to[out=180,in=0] ++ (-2,-0.2cm) node[left]{pôle sud};
\draw[blue] (G) to[out=180,in=0]++(-\R,-1)node[left]{Greenwich};
\draw[blue,tdplot_screen_coords] (0.5,-1) to[out=-30,in=160]++(\R,-1)node[right]{longitude};
\draw[blue,tdplot_screen_coords] (M) -- ++ (0.2,-1) node[below]{meridien};
\end{tikzpicture}
Electromagnétisme
 |
 |
 |
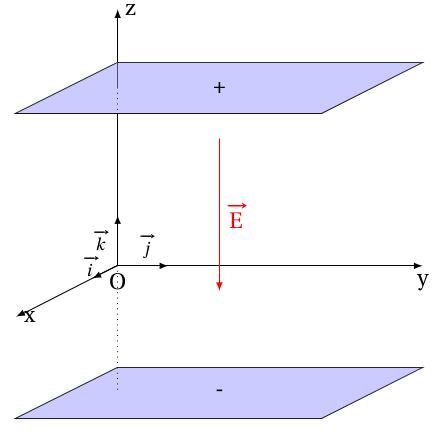
\begin{tikzpicture}[scale=0.8]
%condensateur
\draw [->,>=latex] (0,3.5) --++(0,1.55) node [right] {z};
\draw (0,0)--++(0,3);
\draw [->,>=latex] (0,0) --++(-2,-1) node [right] {x};
\draw [->,>=latex] (0,0) --++(6,0) node [below] {y};
\draw [->,>=latex] (0,0) --++(0,1) node [right] {};
\draw [->,>=latex] (0,0) --++(-0.5,-0.25) node [right] {};
\draw [->,>=latex] (0,0) --++(1,0) node [below] {};
\node (O) at (0,0) [below] {O};
\node (i) at (-0.2,0) [left] {$\scriptstyle \vec{i}$};
\node (j) at (0.6,0) [above] {$\scriptstyle \vec{j}$};
\node (k) at (0,0.5) [left] {$\scriptstyle \vec{k}$};
\draw [->,>=latex,color=red] (2,2.5)--(2,-0.5) node [midway,right] {$\vec{E}$};
\draw (0,4) --++ (6,0) --++(-2,-1) --++ (-6,0)--cycle;
\draw (0,-2) --++ (6,0) --++(-2,-1) --++ (-6,0)--cycle;
\fill[color=blue!40,opacity=0.5] (0,4) --++ (6,0) --++(-2,-1) --++ (-6,0)--cycle;
\fill [color=blue!40,opacity=0.5](0,-2) --++ (6,0) --++(-2,-1) --++ (-6,0)--cycle;
\draw [dotted] (0,3.5)--++(0,-0.5);
\draw [dotted] (0,0)--++(0,-2.5);
\node at (2,3.5) {+};
\node at (2,-2.5) {-};
\end{tikzpicture}
%fin condensateur
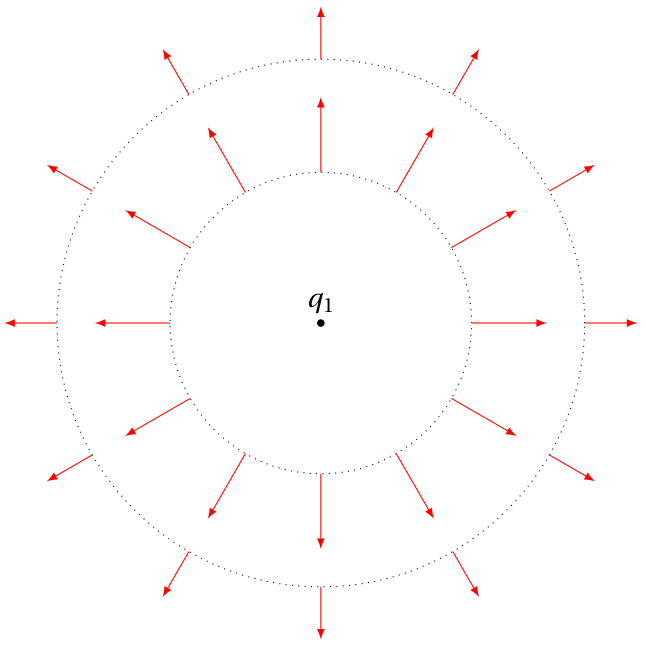
%champ électrostatique
\begin{tikzpicture}[scale=1]
\foreach \x in {0,1,...,11} \draw [->,>=latex,color=red] ({3.5*cos(30*\x)},{3.5*sin(30*\x)}) --++ ({0.7*cos(30*\x)},{0.7*sin(30*\x)});
\draw [dotted] (3.5,0) arc (0:360:3.5);
\foreach \x in {0,1,...,11} \draw [->,>=latex,color=red] ({2*cos(30*\x)},{2*sin(30*\x)}) --++ ({cos(30*\x)},{sin(30*\x)});
\draw [dotted] (2,0) arc (0:360:2);
\node [above] at (0,0) {$q_1$};
\fill (0,0) circle (0.05);
\end{tikzpicture}
%fin champ électrostatique
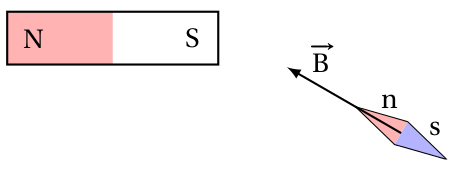
\begin{tikzpicture}[scale=0.7]
\clip (-2.1,-2.3) rectangle (6.5,1); % découpe de la figure selon les dimensions
\path (-3,0) coordinate (A); %attribution d'un nom à un point
\path (3,0) coordinate (B);
%aimant
\fill [color=red!30] (-2,-0.5) rectangle (0,0.5);
\node at (-1.5,0) {N};
\node at (1.5,0) {S};
\draw[thick] (-2,-0.5) rectangle (2,0.5);
\begin{scope}[xshift=4.6cm,yshift=-1.3cm,rotate=-30,scale=0.5]
%boussole
\fill [color=red!30] (0,0) --++ (2,0.5) --++ (0,-1) --cycle;
\fill [color=blue!30] (2,0.5) --++ (2,-0.5) --++ (-2,-0.5) --cycle;
\draw [->,>=latex, thick] (2,0) --++ (-5,0);
\node at(-2,1){$ \vec{B}$};
\node at (1,0.8) {n};
\node at (3,0.8) {s};
\draw (0,0) --++ (2,0.5) --++ (2,-0.5) --++ (-2,-0.5) --cycle;
\end{scope}
\end{tikzpicture}
 |
 |
 |
%Spectre aimant droit
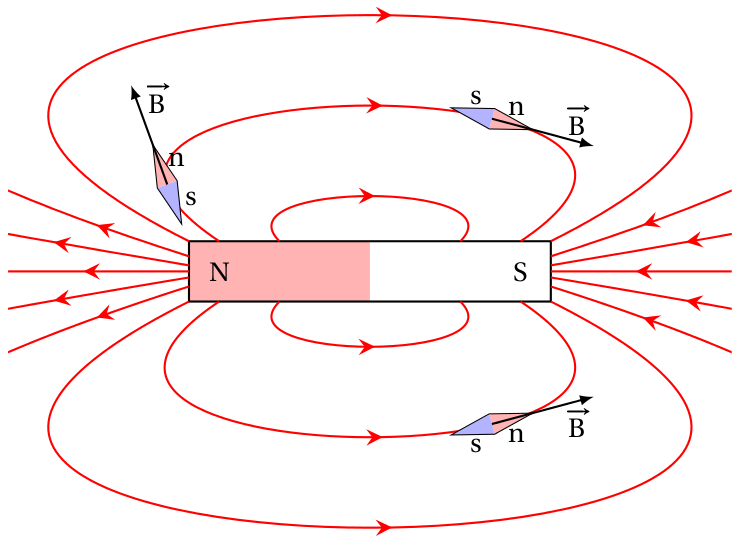
\begin{tikzpicture}[scale=0.8]
\clip (-6,-4.5) rectangle (6,4.5); % découpe de la figure selon les dimensions
\path (-3,0) coordinate (A); %attribution d'un nom à un point
\path (3,0) coordinate (B);
%aimant
\fill [color=red!30] (-3,-0.5) rectangle (0,0.5);
\node at (-2.5,0) {N};
\node at (2.5,0) {S};
\draw[thick] (-3,-0.5) rectangle (3,0.5);
%lignes de champ
\begin{scope} %application de style à une partie de code
\tikzstyle arrowstyle=[scale=1.5];%taille de flèche
\tikzstyle directed=[postaction={decorate,decoration={markings,mark=at position .52 with {\arrow[arrowstyle]{stealth}}}}];
\draw[red,thick, directed] (-1.5,0.5) .. controls +(-1,1) and +(1,1) .. (1.5,0.5);
\draw[red,thick, directed] (-2.5,0.5) .. controls +(-4.5,3) and +(4.5,3) .. (2.5,0.5);
\draw[red,thick, directed] (-3,0.5) .. controls +(-10,5) and +(10,5) .. (3,0.5);
\draw[red,thick, directed,yscale=-1] (-1.5,0.5) .. controls +(-1,1) and +(1,1) .. (1.5,0.5);%yscale permet de retourner verticalement la figure
\draw[red,thick, directed,yscale=-1] (-2.5,0.5) .. controls +(-4.5,3) and +(4.5,3) .. (2.5,0.5);
\draw[red,thick, directed,yscale=-1] (-3,0.5) .. controls +(-10,5) and +(10,5) .. (3,0.5);
\end{scope}
\begin{scope}
\tikzstyle arrowstyle=[scale=1.5];
\draw[red,thick, postaction={decorate,decoration={markings,mark=at position .05 with{\arrow[arrowstyle]{stealth}}}},postaction={decorate,decoration={markings,mark=at position .95 with {\arrow[arrowstyle]{stealth}}}} ] (-3,0.25) .. controls +(-22,7) and +(22,7) .. (3,0.25);
\draw[red,thick, postaction={decorate,decoration={markings,mark=at position .03 with {\arrow[arrowstyle]{stealth}}}},postaction={decorate,decoration={markings,mark=at position .97 with {\arrow[arrowstyle]{stealth}}}} ] (-3,0.1) .. controls +(-60,10) and +(60,10) .. (3,0.1);
\draw[red,thick, postaction={decorate,decoration={markings,mark=at position .25 with {\arrow[arrowstyle]{stealth}}}}] (A) -- (-10,0); %ligne dans l'axe
\draw[red,thick, postaction={decorate,decoration={markings,mark=at position .25 with {\arrowreversed[arrowstyle]{stealth}}}}] (B) -- (10,0);%ligne dans l'axe
\draw[red,yscale=-1,thick, postaction={decorate,decoration={markings,mark=at position .05 with{\arrow[arrowstyle]{stealth}}}},postaction={decorate,decoration={markings,mark=at position .95 with {\arrow[arrowstyle]{stealth}}}} ] (-3,0.25) .. controls +(-22,7) and +(22,7) .. (3,0.25);
\draw[red,yscale=-1,thick, postaction={decorate,decoration={markings,mark=at position .03 with {\arrow[arrowstyle]{stealth}}}},postaction={decorate,decoration={markings,mark=at position .97 with {\arrow[arrowstyle]{stealth}}}} ] (-3,0.1) .. controls +(-60,10) and +(60,10) .. (3,0.1);
\end{scope}
\begin{scope}[xshift=-3.6cm,yshift=2.1cm,rotate=-70,scale=0.35]
%boussole
\fill [color=red!30] (0,0) --++ (2,0.5) --++ (0,-1) --cycle;
\fill [color=blue!30] (2,0.5) --++ (2,-0.5) --++ (-2,-0.5) --cycle;
\draw [->,>=latex, thick] (2,0) --++ (-5,0);
\node at(-2,1){$ \vec{B}$};
\node at (1,0.8) {n};
\node at (3,0.8) {s};
\draw (0,0) --++ (2,0.5) --++ (2,-0.5) --++ (-2,-0.5) --cycle;
\end{scope}
\begin{scope}[xshift=2.7cm,yshift=-2.35cm,rotate=195,scale=0.35]
%boussole
\fill [color=red!30] (0,0) --++ (2,0.5) --++ (0,-1) --cycle;
\fill [color=blue!30] (2,0.5) --++ (2,-0.5) --++ (-2,-0.5) --cycle;
\draw [->,>=latex, thick] (2,0) --++ (-5,0);
\node at(-2,1){$ \vec{B}$};
\node at (1,0.8) {n};
\node at (3,0.8) {s};
\draw (0,0) --++ (2,0.5) --++ (2,-0.5) --++ (-2,-0.5) --cycle;
\end{scope}
\begin{scope}[xshift=2.7cm,yshift=2.35cm,rotate=165,scale=0.35,yscale=-1]
%boussole
\fill [color=red!30] (0,0) --++ (2,0.5) --++ (0,-1) --cycle;
\fill [color=blue!30] (2,0.5) --++ (2,-0.5) --++ (-2,-0.5) --cycle;
\draw [->,>=latex, thick] (2,0) --++ (-5,0);
\node at(-2,1){$ \vec{B}$};
\node at (1,0.8) {n};
\node at (3,0.8) {s};
\draw (0,0) --++ (2,0.5) --++ (2,-0.5) --++ (-2,-0.5) --cycle;
\end{scope}
\end{tikzpicture}
%Champ aimant U
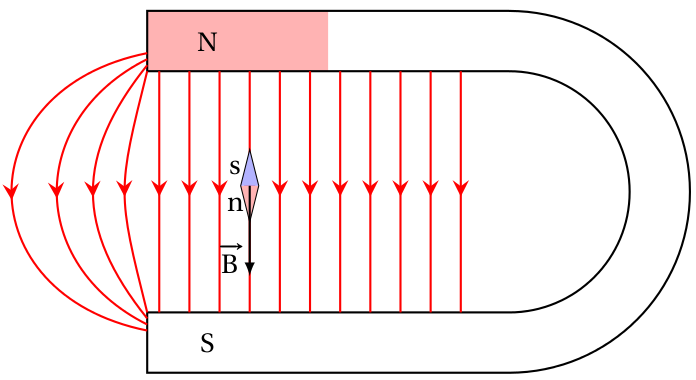
\begin{tikzpicture}[scale=0.8]
\tikzstyle arrowstyle=[scale=1.5];%taille de flèche
\tikzstyle directed=[postaction={decorate,decoration={markings,mark=at position .52 with {\arrow[arrowstyle]{stealth}}}}];
\clip (-3,-5.2) rectangle (10,1.2); % découpe de la figure selon les dimensions
\path (-3,0) coordinate (A); %attribution d'un nom à un point
\path (3,0) coordinate (B);
%aimant U
\fill [color=red!30] (0,0) rectangle (3,1);
\node at (1,0.5) {N};
\node at (1,-4.5) {S};
\draw[thick] (0,0) --++ (0,1) --++ (6,0) arc (90:-90:3) --++ (-6,0) --++ (0,1) --++ (6,0) arc(-90:90:2) -- cycle;
%lignes de champ
\foreach \y in {0.2,0.7,...,5.2}
{
\draw[color=red,thick,directed] (\y,0) --++ (0,-4);
}
\draw[red,thick, directed] (0,0) .. controls +(-0.5,-2) and +(-0.5,2) .. (0,-4);
\draw[red,thick, directed] (0,0.1) .. controls +(-1.2,-1.5) and +(-1.2,1.5) .. (0,-4.1);
\draw[red,thick, directed] (0,0.2) .. controls +(-2,-1) and +(-2,1) .. (0,-4.2);
\draw[red,thick, directed] (0,0.3) .. controls +(-3,-0.6) and +(-3,0.6) .. (0,-4.3);
\begin{scope}[xshift=1.7cm,yshift=-2.5cm,rotate=90,scale=0.3]
%boussole
\fill [color=red!30] (0,0) --++ (2,0.5) --++ (0,-1) --cycle;
\fill [color=blue!30] (2,0.5) --++ (2,-0.5) --++ (-2,-0.5) --cycle;
\draw [->,>=latex, thick] (2,0) --++ (-5,0);
\node at(-2,1){$ \vec{B}$};
\node at (1,0.8) {n};
\node at (3,0.8) {s};
\draw (0,0) --++ (2,0.5) --++ (2,-0.5) --++ (-2,-0.5) --cycle;
\end{scope}
\end{tikzpicture}
%Spectre solénoïde
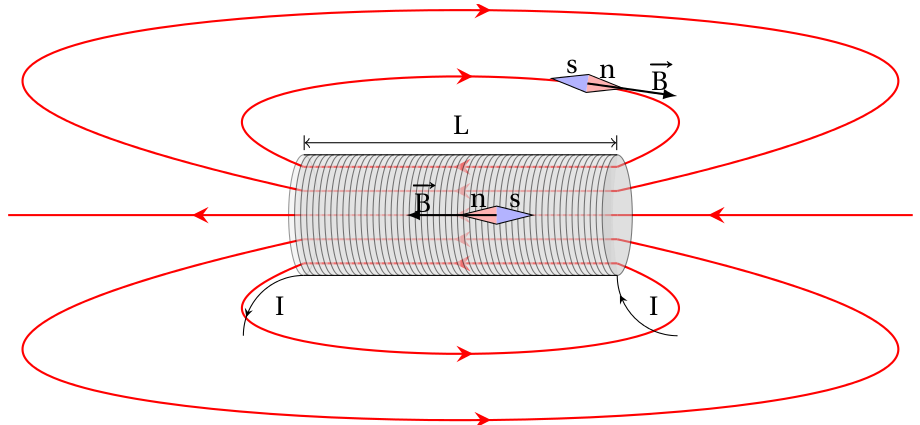
\begin{tikzpicture}[scale=0.8]\clip (-7.5,-3.5) rectangle (7.5,3.5); % découpe de la figure selon les dimensions
\tikzstyle simplerev=[postaction={decorate,decoration={markings, mark=at position .3 with {\arrow[scale=1,>=stealth]{<}}}}]
\tikzstyle simple=[postaction={decorate,decoration={markings, mark=at position .8 with {\arrow[scale=1,>=stealth]{>}}}}]
\tikzstyle arrowstyle=[scale=1.5];%taille de flèche
\tikzstyle directed=[postaction={decorate,decoration={markings,mark=at position .52 with {\arrow[arrowstyle]{stealth}}}}];
\filldraw [fill=gray!20,draw=black,opacity=0.4] (-2.6,0) ellipse (0.25cm and 1cm);
\filldraw [gray!20,opacity=0.5] (-2.6,-1) to [bend left=8] (-2.6,1) -- (2.6,1) to [bend right=8] (2.6,-1) -- cycle;
\foreach \y in {-0.8,-0.4,...,0.9}
{
\draw[color=red,thick,directed] (2.6,\y) --++ (-5.2,0);
}
\draw[red,thick, directed] (-2.6,0.8) .. controls +(-5,2) and +(5,2) .. (2.6,0.8);
\draw[red,thick, directed] (-2.6,0.4) .. controls +(-18,4) and +(18,4) .. (2.6,0.4);
\draw[red,thick, directed,yscale=-1] (-2.6,0.8) .. controls +(-5,2) and +(5,2) .. (2.6,0.8);
\draw[red,thick, directed,yscale=-1] (-2.6,0.4) .. controls +(-18,4) and +(18,4) .. (2.6,0.4);
\draw[red,thick, postaction={decorate,decoration={markings,mark=at position .25 with {\arrow[arrowstyle]{stealth}}}}] (-2.6,0) -- (-10,0); %ligne dans l'axe
\draw[red,thick, postaction={decorate,decoration={markings,mark=at position .25 with {\arrowreversed[arrowstyle]{stealth}}}}] (2.6,0) -- (10,0);%ligne dans l'axe
\foreach \x in {-2.5,-2.4,...,2.6}
{
\filldraw [fill=gray!25,draw=black,opacity=0.5] (\x,1) arc (90:270:0.25cm and 1cm); %arc elliptique
}
\filldraw [fill=gray!50,draw=black,opacity=0.5] (2.6,0) ellipse (0.25cm and 1cm);
\draw (-2.6,1) -- (2.6,1);
\draw (-2.6,-1) -- (2.6,-1);
\draw [ |<->|] (-2.6,1.2) -- (2.6,1.2) node [midway, above] {$L$};
\draw [simple] (-2.6,-1) to [bend right=45] ++(-1,-1) ;
\node at (-3,-1.5) {I};
\draw [simplerev] (2.6,-1) to [bend right=45] ++(1,-1) ;
\node at (3.2,-1.5) {I};
\begin{scope}[xshift=2.7cm,yshift=2.1cm,rotate=172,scale=0.3,yscale=-1]
%boussole
\fill [color=red!30] (0,0) --++ (2,0.5) --++ (0,-1) --cycle;
\fill [color=blue!30] (2,0.5) --++ (2,-0.5) --++ (-2,-0.5) --cycle;
\draw [->,>=latex, thick] (2,0) --++ (-5,0);
\node at(-2,1){$ \vec{B}$};
\node at (1,0.8) {n};
\node at (3,0.8) {s};
\draw (0,0) --++ (2,0.5) --++ (2,-0.5) --++ (-2,-0.5) --cycle;
\end{scope}
\begin{scope}[scale=0.3]
%boussole
\fill [color=red!30] (0,0) --++ (2,0.5) --++ (0,-1) --cycle;
\fill [color=blue!30] (2,0.5) --++ (2,-0.5) --++ (-2,-0.5) --cycle;
\draw [->,>=latex, thick] (2,0) --++ (-5,0);
\node at(-2,1){$ \vec{B}$};
\node at (1,0.8) {n};
\node at (3,0.8) {s};
\draw (0,0) --++ (2,0.5) --++ (2,-0.5) --++ (-2,-0.5) --cycle;
\end{scope}
\end{tikzpicture}
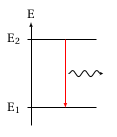
Laser
 |
 |
 |
\begin{tikzpicture}[scale=1]
\draw [->,>=latex] (0,0) --++ (0,3) node [above]{E};
\draw (-0.1,0.5) --++ (2,0);
\draw (-0.1,2.5) --++ (2,0);
\draw [->,>=latex,color=red] (1,2.5) --++ (0,-2);
\node at (-0.5,0.5) {$ E_1$};
\node at (-0.5,2.5) {$ E_2$};
\draw [->,>=stealth,snake=snake] (1.1,1.5) --++(1,0);
\end{tikzpicture}
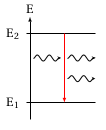
\begin{tikzpicture}[scale=1]
\draw [->,>=latex] (0,0) --++ (0,3) node [above]{E};
\draw (-0.1,0.5) --++ (2,0);
\draw (-0.1,2.5) --++ (2,0);
\draw [->,>=latex,color=red] (1,2.5) --++ (0,-2);
\node at (-0.5,0.5) {$ E_1$};
\node at (-0.5,2.5) {$ E_2$};
\draw [->,>=stealth,snake=snake] (1.1,1.8) --++(0.8,0);
\draw [->,>=stealth,snake=snake] (1.1,1.2) --++(0.8,0);
\draw [->,>=stealth,snake=snake] (0.1,1.8) --++(0.8,0);
\end{tikzpicture}
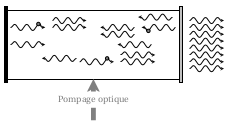
\begin{tikzpicture}[scale=1]
\draw (0,0) rectangle (5,2);
\draw[fill=black] (-0.1,-0.1) rectangle (0,2.1);
\draw[fill=gray!50] (5,-0.1) rectangle (5.1,2.1);
\begin{scope}
\draw [->,>=stealth,snake=snake] (0.1,1.5) --++(1,0);
\draw [->,>=stealth,snake=snake] (0.1,1) --++(1,0);
\draw [fill=gray] (0.9,1.6) circle (0.05);
\draw [->,>=stealth,snake=snake] (1.3,1.5) --++(1,0);
\draw [->,>=stealth,snake=snake] (1.3,1.7) --++(1,0);
\end{scope}
\foreach \x in {0.3,0.5,...,1.7} \draw[->,>=stealth,snake=snake] (5.3,\x) --++(1,0);
\draw [->,>=stealth,snake=snake] (4.8,1.8) --++(-1,0);
\draw [->,>=stealth,snake=snake] (4.2,1) --++(-1,0);
\draw [->,>=stealth,snake=snake] (2,0.6) --++(-1,0);
\draw[line width=4pt,>=stealth,->,gray](2.5,-1.2) --++(0,1.2)node [midway,fill=white] {\footnotesize Pompage optique};
\begin{scope}[xshift=2cm,yshift=-1cm]
\draw [->,>=stealth,snake=snake] (0.1,1.5) --++(1,0);
\draw [fill=gray] (0.9,1.6) circle (0.05);
\draw [->,>=stealth,snake=snake] (1.3,1.5) --++(1,0);
\draw [->,>=stealth,snake=snake] (1.3,1.7) --++(1,0);
\end{scope}
\begin{scope}[xshift=5cm,yshift=3cm,rotate=180]
\draw [->,>=stealth,snake=snake] (0.1,1.5) --++(1,0);
\draw [fill=gray] (0.9,1.6) circle (0.05);
\draw [->,>=stealth,snake=snake] (1.3,1.5) --++(1,0);
\draw [->,>=stealth,snake=snake] (1.3,1.7) --++(1,0);
\end{scope}
\end{tikzpicture}
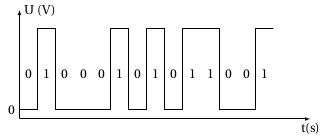
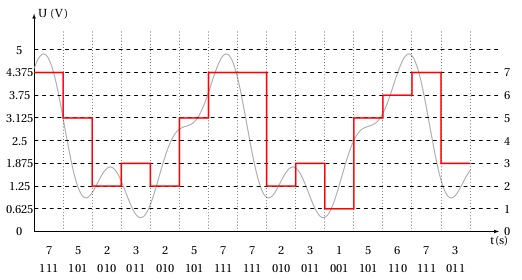
Numérisation d'un signal
 |
 |
%signal analogique
\begin{tikzpicture}[scale=0.5]
\draw [->,>=latex] (0,0) --++(0,6) node [right] {U (V)};
\draw [->,>=latex] (0,0) --++(16,0) node [below] {t(s)};
\node (O) at (0,0) [left] {0};
\draw[smooth,samples=100,domain=0:15,color=gray!70] plot(\x,{2*cos(\x r)+0.5*cos(2*\x r)+0.7*sin(3*\x r)+2.3});
\end{tikzpicture}
%signal numérique
\begin{tikzpicture}[scale=0.5]
\draw [->,>=latex] (0,-0.5) --++(0,6) node [right] {U (V)};
\draw [->,>=latex] (0,-0.5) --++(16,0) node [below] {t(s)};
\node (O) at (0,0) [left] {0};
\newcommand{\signalnumerique}{(0,0)(1,0)(1,4.5)(2,4.5)(2,0)(5,0)(5,4.5)(6,4.5)(6,0)(7,0)(7,4.5)(8,4.5)(8,0)(9,0)(9,4.5)(11,4.5)(11,0)(13,0)(13,4.5)(14,4.5)}
\draw plot coordinates {\signalnumerique};
\node at (0.5,2) {0};
\node at (1.5,2) {1};
\node at (2.5,2) {0};
\node at (3.5,2) {0};
\node at (4.5,2) {0};
\node at (5.5,2) {1};
\node at (6.5,2) {0};
\node at (7.5,2) {1};
\node at (8.5,2) {0};
\node at (9.5,2) {1};
\node at (10.5,2) {1};
\node at (11.5,2) {0};
\node at (12.5,2) {0};
\node at (13.5,2) {1};
\end{tikzpicture}
 |
 |
 |
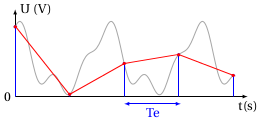
\begin{tikzpicture}[scale=0.4]
\draw [->,>=latex] (0,0) --++(0,6) node [right] {U (V)};
\draw [->,>=latex] (0,0) --++(16,0) node [below] {t(s)};
\node (O) at (0,0) [left] {0};
\draw[smooth,samples=100,domain=0:15,color=gray!70] plot(\x,{2*cos(\x r)+0.5*cos(2*\x r)+0.7*sin(3*\x r)+2.3});
\draw[samples=100,domain=0:15,color=blue,samples=5,mark=*,ycomb] plot(\x,{2*cos(\x r)+0.5*cos(2*\x r)+0.7*sin(3*\x r)+2.3});
\draw[samples=100,domain=0:15,color=red,samples=5,mark=*] plot(\x,{2*cos(\x r)+0.5*cos(2*\x r)+0.7*sin(3*\x r)+2.3});
\draw [<->,>=latex,color=blue] (7.5,-0.5) --++ (3.9,0) node [below,midway] {Te};
\end{tikzpicture}
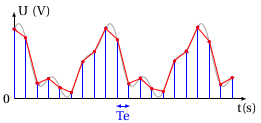
\begin{tikzpicture}[scale=0.4]
\draw [->,>=latex] (0,0) --++(0,6) node [right] {U (V)};
\draw [->,>=latex] (0,0) --++(16,0) node [below] {t(s)};
\node (O) at (0,0) [left] {0};
\draw[smooth,samples=100,domain=0:15,color=gray!70] plot(\x,{2*cos(\x r)+0.5*cos(2*\x r)+0.7*sin(3*\x r)+2.3});
\draw[domain=0:15,color=blue,samples=20,mark=*,ycomb] plot(\x,{2*cos(\x r)+0.5*cos(2*\x r)+0.7*sin(3*\x r)+2.3});
\draw[domain=0:15,color=red,samples=20,mark=*] plot(\x,{2*cos(\x r)+0.5*cos(2*\x r)+0.7*sin(3*\x r)+2.3});
\draw [<->,>=latex,color=blue] (7,-0.5) --++ (1,0) node [below,midway] {Te};
\end{tikzpicture}
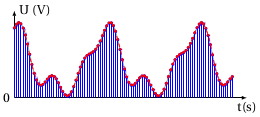
\begin{tikzpicture}[scale=0.4]
\draw [->,>=latex] (0,0) --++(0,6) node [right] {U (V)};
\draw [->,>=latex] (0,0) --++(16,0) node [below] {t(s)};
\node (O) at (0,0) [left] {0};
\draw[smooth,samples=100,domain=0:15,color=gray!70] plot(\x,{2*cos(\x r)+0.5*cos(2*\x r)+0.7*sin(3*\x r)+2.3});
\draw[domain=0:15,color=blue,samples=100,mark=*,ycomb] plot(\x,{2*cos(\x r)+0.5*cos(2*\x r)+0.7*sin(3*\x r)+2.3});
\draw[domain=0:15,color=red,dashed,samples=100,mark=*] plot(\x,{2*cos(\x r)+0.5*cos(2*\x r)+0.7*sin(3*\x r)+2.3});
\end{tikzpicture}
 |
 |
 |
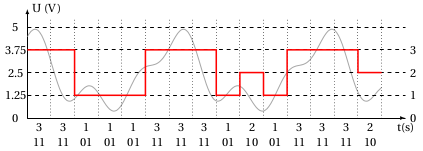
%2bits
\begin{tikzpicture}[x=0.65cm, y=0.5cm ,font=\small]
\draw [->,>=latex] (0,0) --++(0,6) node [right] {U (V)};
\draw [->,>=latex] (0,0) --++(16,0) node [below] {t(s)};
\draw[smooth,samples=100,domain=0:15,color=gray!70] plot(\x,{1.7*cos(\x r)+0.5*cos(2*\x r)+0.7*sin(3*\x r)+2.3});
\pgfmathsetmacro{\bit}{2}; %entrer le nombre de bits ici
\pgfmathsetmacro{\valmax}{2^\bit-1};
\pgfmathsetmacro{\pas}{5/(\valmax+1};
\foreach \y in {0,1,...,\valmax} \draw[dashed](0,{5*\y/(\valmax+1)}) --++ (16,0) node[right]{\y};
\draw [dashed] (0,5) --++ (16,0);
\foreach \z in {0,\pas,...,5} \node at (-0.5,{\z}) {\z};
\foreach \x in {0,1,...,15} \draw[dotted](\x,0) --++ (0,5.5);
\newcommand{\signalobtenu}{(0,3.75)(1,3.75)(2,1.25)(3,1.25)(4,1.25)(5,3.75)(6,3.75)(7,3.75)(8,1.25)(9,2.5)(10,1.25)(11,3.75)(12,3.75)(13,3.75)(14,2.5)(15,2.5)}
\draw[samples=100,domain=0:15,color=red,samples=5,const plot,very thick] plot coordinates {\signalobtenu};
\node at (0.5,-0.5) {3};
\node at (1.5,-0.5) {3};
\node at (2.5,-0.5) {1};
\node at (3.5,-0.5) {1};
\node at (4.5,-0.5) {1};
\node at (5.5,-0.5) {3};
\node at (6.5,-0.5) {3};
\node at (7.5,-0.5) {3};
\node at (8.5,-0.5) {1};
\node at (9.5,-0.5) {2};
\node at (10.5,-0.5) {1};
\node at (11.5,-0.5) {3};
\node at (12.5,-0.5) {3};
\node at (13.5,-0.5) {3};
\node at (14.5,-0.5) {2};
\node at (0.5,-1.3) {11};
\node at (1.5,-1.3) {11};
\node at (2.5,-1.3) {01};
\node at (3.5,-1.3) {01};
\node at (4.5,-1.3) {01};
\node at (5.5,-1.3) {11};
\node at (6.5,-1.3) {11};
\node at (7.5,-1.3) {11};
\node at (8.5,-1.3) {01};
\node at (9.5,-1.3) {10};
\node at (10.5,-1.3) {01};
\node at (11.5,-1.3) {11};
\node at (12.5,-1.3) {11};
\node at (13.5,-1.3) {11};
\node at (14.5,-1.3) {10};
\end{tikzpicture}
%3bits
\begin{tikzpicture}[x=0.8cm, y=1cm ,font=\small]
\draw [->,>=latex] (0,0) --++(0,6) node [right] {U (V)};
\draw [->,>=latex] (0,0) --++(16,0) node [below] {t(s)};
\draw[smooth,samples=100,domain=0:15,color=gray!70] plot(\x,{1.7*cos(\x r)+0.5*cos(2*\x r)+0.7*sin(3*\x r)+2.3});
\pgfmathsetmacro{\bit}{3}; %entrer le nombre de bits ici
\pgfmathsetmacro{\valmax}{2^\bit-1};
\pgfmathsetmacro{\pas}{5/(\valmax+1};
\foreach \y in {0,1,...,\valmax} \draw[dashed](0,{5*\y/(\valmax+1)}) --++ (16,0) node[right]{\y};
\draw [dashed] (0,5) --++ (16,0);
\foreach \z in {0,\pas,...,5} \node at (-0.5,{\z}) {\z};
\foreach \x in {0,1,...,15} \draw[dotted](\x,0) --++ (0,5.5);
\newcommand{\signalobtenu}{(0,4.375)(1,3.125)(2,1.25)(3,1.875)(4,1.25)(5,3.125)
(6,4.375)(7,4.375)(8,1.25)(9,1.875)(10,0.625)(11,3.125)(12,3.75)
(13,4.375)(14,1.875)(15,1.875)}
\draw[samples=100,domain=0:15,color=red,samples=5,const plot,very thick] plot coordinates {\signalobtenu};
\node at (0.5,-0.5) {7};
\node at (1.5,-0.5) {5};
\node at (2.5,-0.5) {2};
\node at (3.5,-0.5) {3};
\node at (4.5,-0.5) {2};
\node at (5.5,-0.5) {5};
\node at (6.5,-0.5) {7};
\node at (7.5,-0.5) {7};
\node at (8.5,-0.5) {2};
\node at (9.5,-0.5) {3};
\node at (10.5,-0.5) {1};
\node at (11.5,-0.5) {5};
\node at (12.5,-0.5) {6};
\node at (13.5,-0.5) {7};
\node at (14.5,-0.5) {3};
\node at (0.5,-1) {111};
\node at (1.5,-1) {101};
\node at (2.5,-1) {010};
\node at (3.5,-1) {011};
\node at (4.5,-1) {010};
\node at (5.5,-1) {101};
\node at (6.5,-1) {111};
\node at (7.5,-1) {111};
\node at (8.5,-1) {010};
\node at (9.5,-1) {011};
\node at (10.5,-1) {001};
\node at (11.5,-1) {101};
\node at (12.5,-1) {110};
\node at (13.5,-1) {111};
\node at (14.5,-1) {011};
\end{tikzpicture}
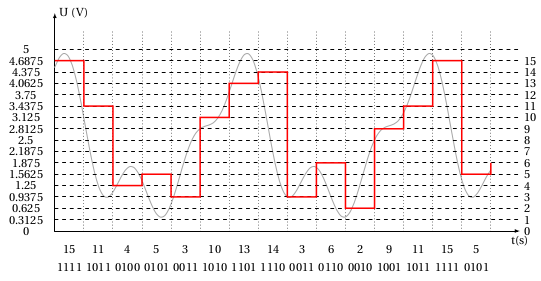
%4bits
\begin{tikzpicture}[x=0.8cm, y=1cm ,font=\small]
\draw [->,>=latex] (0,0) --++(0,6) node [right] {U (V)};
\draw [->,>=latex] (0,0) --++(16,0) node [below] {t(s)};
\draw[smooth,samples=100,domain=0:15,color=gray!70] plot(\x,{1.7*cos(\x r)+0.5*cos(2*\x r)+0.7*sin(3*\x r)+2.3});
\pgfmathsetmacro{\bit}{4}; %entrer le nombre de bits ici
\pgfmathsetmacro{\valmax}{2^\bit-1};
\pgfmathsetmacro{\pas}{5/(\valmax+1};
\foreach \y in {0,1,...,\valmax} \draw[dashed](0,{5*\y/(\valmax+1)}) --++ (16,0) node[right]{\y};
\draw [dashed] (0,5) --++ (16,0);
\foreach \z in {0,\pas,...,5} \node at (-1,{\z}) {\z};
\foreach \x in {0,1,...,15} \draw[dotted](\x,0) --++ (0,5.5);
\newcommand{\signalobtenu}{(0,4.6875)(1,3.4375)(2,1.25)(3,1.5625)(4,0.9375)(5,3.125)(6,4.0625)(7,4.375)(8,0.9375)(9,1.875)(10,0.625)(11,2.8125)(12,3.4375)(13,4.6875)(14,1.5625)(15,1.875)}
\draw[samples=100,domain=0:15,color=red,samples=5,const plot,very thick] plot coordinates {\signalobtenu};
\node at (0.5,-0.5) {15};
\node at (1.5,-0.5) {11};
\node at (2.5,-0.5) {4};
\node at (3.5,-0.5) {5};
\node at (4.5,-0.5) {3};
\node at (5.5,-0.5) {10};
\node at (6.5,-0.5) {13};
\node at (7.5,-0.5) {14};
\node at (8.5,-0.5) {3};
\node at (9.5,-0.5) {6};
\node at (10.5,-0.5) {2};
\node at (11.5,-0.5) {9};
\node at (12.5,-0.5) {11};
\node at (13.5,-0.5) {15};
\node at (14.5,-0.5) {5};
\node at (0.5,-1) {1111};
\node at (1.5,-1) {1011};
\node at (2.5,-1) {0100};
\node at (3.5,-1) {0101};
\node at (4.5,-1) {0011};
\node at (5.5,-1) {1010};
\node at (6.5,-1) {1101};
\node at (7.5,-1) {1110};
\node at (8.5,-1) {0011};
\node at (9.5,-1) {0110};
\node at (10.5,-1) {0010};
\node at (11.5,-1) {1001};
\node at (12.5,-1) {1011};
\node at (13.5,-1) {1111};
\node at (14.5,-1) {0101};
\end{tikzpicture}
 |
 |
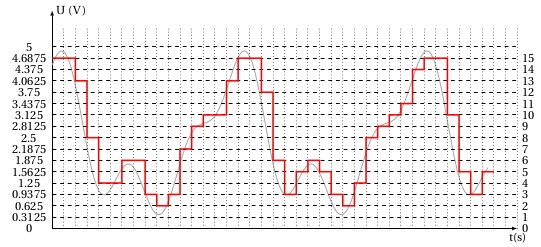
\begin{tikzpicture}[x=0.8cm, y=1cm, font=\small ] %4bits
\draw [->,>=latex] (0,0) --++(0,6) node [right] {U (V)};
\draw [->,>=latex] (0,0) --++(16,0) node [below] {t(s)};
\draw[smooth,samples=100,domain=0:15,color=gray!70] plot(\x,{1.7*cos(\x r)+0.5*cos(2*\x r)+0.7*sin(3*\x r)+2.3});
\pgfmathsetmacro{\bit}{4}; %entrer le nombre de bits ici
\pgfmathsetmacro{\valmax}{2^\bit-1};
\pgfmathsetmacro{\pas}{5/(\valmax+1};
\foreach \y in {0,1,...,\valmax} \draw[dashed](0,{5*\y/(\valmax+1)}) --++ (16,0) node[right]{\y};
\draw [dashed] (0,5) --++ (16,0);
\foreach \z in {0,\pas,...,5} \node at (-0.8,{\z}) {\z};
\foreach \x in {0,0.4,...,16} \draw[dotted](\x,0) --++ (0,5.5);
\newcommand{\signalobtenu}{(0,4.6875)(0.4,4.6875)(0.8,4.0625)(1.2,2.5)(1.6,1.25)
(2,1.25)(2.4,1.875)(2.8,1.875)(3.2,0.9375)(3.6,0.625)(4,0.9375)
(4.4,2.1875)(4.8,2.8125)(5.2,3.125)(5.6,3.125)(6,4.0625)(6.4,4.6875)
(6.8,4.6875)(7.2,3.75)(7.6,1.875)(8,0.9375)(8.4,1.5625)(8.8,1.875)(9.2,1.5625)
(9.6,0.9375)(10,0.625)(10.4,1.25)(10.8,2.5)(11.2,2.8125)(11.6,3.125)
(12,3.4375)(12.4,4.375)(12.8,4.6875)(13.2,4.6875)(13.6,3.125)(14,1.5625)
(14.4,0.9375)(14.8,1.5625)(15.2,1.5625)}
\draw[samples=100,domain=0:15,color=red,samples=5,const plot,very thick] plot coordinates {\signalobtenu};
\end{tikzpicture}
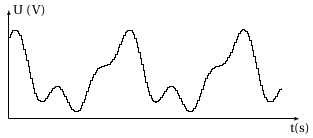
\begin{tikzpicture}[scale=0.5]
\draw [->,>=latex] (0,0) --++(0,6) node [right] {U (V)};
\draw [->,>=latex] (0,0) --++(16,0) node [below] {t(s)};
\draw plot[const plot,variable=\x,domain=0:15,samples=100]
(\x,{1.7*cos(\x r)+0.5*cos(2*\x r)+0.7*sin(3*\x r)+2.3});%sample règle le nombre de marches
\end{tikzpicture}
Montages de chimie
 |
 |
 |
 |
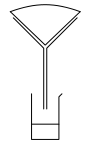
%Filtration
\begin{tikzpicture}[line cap=round,line join=round,>= latex,x=0.08cm,y=0.08cm]
%Entonnoir
\draw (0,0) -- (10,-10) -- (10,-30);
\draw (21,0) -- (11,-10) -- (11,-30);
\draw (-1,2) -- (10.5,-9) -- (22,2);
\draw[-] (-1,2) to[out=20,in=-200] (22,2);
\draw (6,-25) -- (6,-40) -- (15,-40) -- (15,-26) -- (16,-25);
\draw (6,-35) -- (15,-35);
%Fin entonnoir
\end{tikzpicture}
%Fin filtration
%Ampoule à décanter
\begin{tikzpicture}[line cap=round,line join=round,>= latex,x=0.1cm,y=0.1cm]
\draw (0,0) -- (1,-1) -- (1,-5) arc (90:270:10) --(1,-45) -- (2,-48) -- (2,-51);
\draw (5,0) -- (4,-1) -- (4,-5) arc (90:-90:10) --(4,-45) -- (3,-48) -- (3,-51);
\draw (1,-49) -- (5,-49);
\draw (5,-47) -- (5,-51);
\draw (-9,-15) -- (14,-15);
\draw (-8.2,-18) -- (13.2,-18);
\end{tikzpicture}
%Fin ampoule à décanter
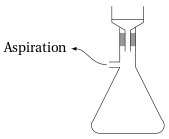
%Buchner
\begin{tikzpicture}[line cap=round,line join=round,>= latex,x=0.07cm,y=0.07cm]
%Bouchon
\fill[color=gray!80] (-3,13) rectangle (-1,18);
\fill[color=gray!80] (1,13) rectangle (3,18);
%Fin bouchon
%Fiole de garde
\draw (-3,20) --++ (0,-13) --++ (-4,0);
\draw (-7,5) --++ (4,0) --++ (-10,-20) arc(140:270:3) --++ (21.5,0)arc(-90:45:3) --++ (-10,20)--++(0,15);
%Fin fiole de garde
%Entonnoir
\draw (-1,11) --++ (0,8)--++(-5,3)--++(0,6);
\draw (1,11) --++ (0,8)--++ (5,3)--++(0,6);
\draw (-6,23) --++ (12,0);
%fin entonnoir
%Annotations
\node[] (EEF) at (-35,12) { Aspiration};
\draw[->,>=latex] (-8,6) to[out=180,in=0] (EEF);
%Fin annotations
\end{tikzpicture}
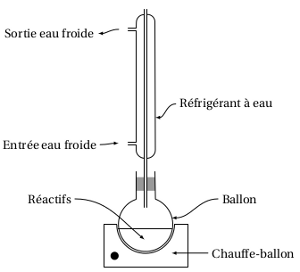
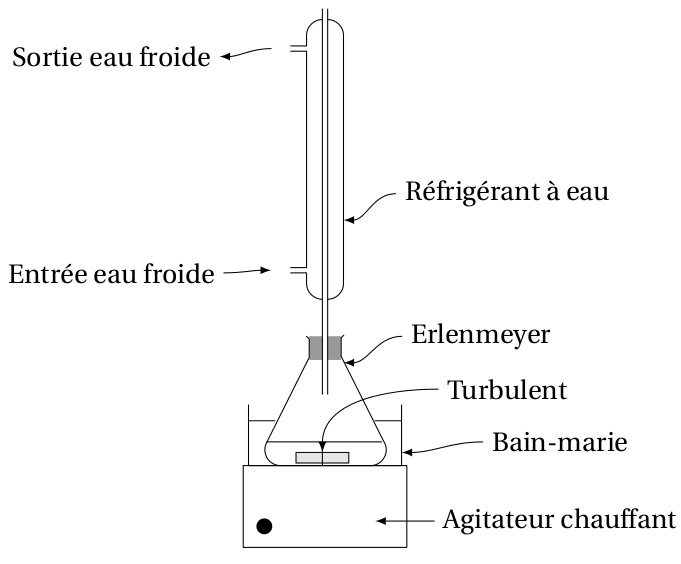
%Montage à reflux
\begin{tikzpicture}[line cap=round,line join=round,>= latex,x=0.08cm,y=0.08cm]
%Bouchon
\fill[color=gray!80] (-3,13) rectangle (0,18);
\fill[color=gray!80] (1,13) rectangle (4,18);
%Fin bouchon
%Ballon
\node[] (A) at (-3,10) {};%col ballon
\node[] (B) at (-3,20) {};%col ballon
\node[] (C) at (4,10) {};%col ballon
\node[] (D) at (4,20) {};%col ballon
\draw (-3,20) -- (-3,10) arc (-250:68.8:10) -- (4,20);
%Fin ballon
%Refrigerant
\draw (0,7) -- (0,80);%tube central
\draw (1,7) -- (1,80);%tube central
\draw (1,25) arc (-90:0:3) -- (4,75) arc (-0:90:3);
\draw (0,78) arc (90:180:3) -- (-3,73) -- (-6,73);
\draw (-6,72) -- (-3,72) -- (-3,31) -- (-6,31);
\draw (-6,30) -- (-3,30) -- (-3,28) arc (-180:-90:3);
%Fin réfrigérant
%Chauffe-ballon
\draw (-10.2,0.5) -- (-15,0.5) -- (-15,-15) -- (16,-15) -- (16,0.5) -- (11,0.5) arc (0:-180:10.6);
\fill (-11,-11) circle (1.5);
%Fin chauffe-ballon
%Niveau liquide
\draw (-9.5,-1) -- (10.2,-1);
%Fin niveau liquide
%Annotations
\node[] (E) at (-8,30.5) {};
\node[] (S) at (-8,72.5) {};
\node[] (EEF) at (-35,30) { Entrée eau froide};
\node[] (SEF) at (-35,71) { Sortie eau froide};
\node[] (Ref) at (30,45) { Réfrigérant à eau};
\node[] (Ballon) at (35,10) { Ballon};
\node[] (Chauf) at (40,-10) { Chauffe-ballon};
\node[] (Rea) at (-35,10) { Réactifs};
\draw[->,>=latex] (EEF) to[out=0,in=180] (E);
\draw[->,>=latex] (S) to[out=180,in=0] (SEF);
\draw[->,>=latex] (Ref) to[out=180,in=0] (4,40);
\draw[->,>=latex] (Chauf) to[out=180,in=0] (10,-10);
\draw[->,>=latex] (Ballon) to[out=180,in=0] (10,3);
\draw[->,>=latex] (Rea) to[out=0,in=140] (0,-5);
%Fin annotations
\end{tikzpicture}
 |
 |
 |
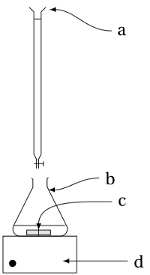
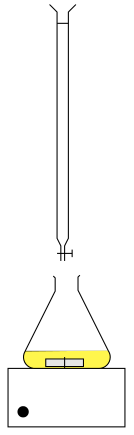
%Montage dosage
\begin{tikzpicture}[scale=0.05]
%Burette
\draw (-4,97) --++ (2,-2) --++ (0,-60) --++ (1,-2) --++ (0,-4);
\draw (3,97) --++ (-2,-2) --++ (0,-60) --++ (-1,-2) --++ (0,-4);
\draw (-2,92) --++ (3,0);
\draw (-2,31) --++ (4,0);
\draw (2,32) --++ (0,-2);
%Fin burette
%Erlenmeyer
\draw(-3,25) --++ (0.5,-0.5) --++ (0,-3.5) --++ (-8,-16) arc(150:270:3) --++ (17,0) arc(-90:35:3) --++ (-8,16) --++ (0,3.5) --++ (0.5,0.5);
%Fin erlenmeyer
%Agitateur
\draw (-10.2,0.5) -- (-15,0.5) -- (-15,-15) -- (16,-15) -- (16,0.5) -- cycle;
\fill (-11,-11) circle (1.5);
%Fin agitateur
%Turbulent
\fill [color=gray!20] (-5,1) --++ (0,2) --++ (10,0) --++ (0,-2) -- cycle;
\draw [] (-5,1) --++ (0,2) --++ (10,0) --++ (0,-2) -- cycle;
\draw (0,0.5) --++ (0,3);
%Fin turbulent
%Niveau liquide
\draw (-10.5,5) -- (11.2,5);
%Fin niveau liquide
%Annotations
\node[] (B) at (35,87) { a};
\node[] (ER) at (30,25) { b};
\node[] (T) at (35,15) { c};
\node[] (Chauf) at (42,-10) { d};
\draw[->,>=latex] (B) to[out=180,in=0] (E);
\draw[->,>=latex] (ER) to[out=180,in=0] (4,20);
\draw[->,>=latex] (Chauf) to[out=180,in=0] (10,-10);
\draw[->,>=latex] (T) to[out=180,in=90] (0,3);
%Fin annotations
\end{tikzpicture}
%fin montage dosage
%Montage dosage I2
\begin{tikzpicture}[scale=0.05]
%Burette
\draw (-4,97) --++ (2,-2) --++ (0,-60) --++ (1,-2) --++ (0,-4);
\draw (3,97) --++ (-2,-2) --++ (0,-60) --++ (-1,-2) --++ (0,-4);
\draw (-2,92) --++ (3,0);
\draw (-2,31) --++ (4,0);
\draw (2,32) --++ (0,-2);
%Fin burette
%Agitateur
\draw (-10.2,0.5) -- (-15,0.5) -- (-15,-15) -- (16,-15) -- (16,0.5) -- cycle;
\fill (-11,-11) circle (1.5);
%Fin agitateur
%Niveau liquide
\draw (-10.5,5) -- (11.2,5);
\fill [color=yellow!70] (-10.5,5) arc(150:270:3) --++ (17,0) arc(-90:35:3) -- cycle;
%Fin niveau liquide
%Turbulent
\fill [color=gray!20] (-5,1) --++ (0,2) --++ (10,0) --++ (0,-2) -- cycle;
\draw [] (-5,1) --++ (0,2) --++ (10,0) --++ (0,-2) -- cycle;
\draw (0,0.5) --++ (0,3);
%Fin turbulent
%Erlenmeyer
\draw(-3,25) --++ (0.5,-0.5) --++ (0,-3.5) --++ (-8,-16) arc(150:270:3) --++ (17,0) arc(-90:35:3) --++ (-8,16) --++ (0,3.5) --++ (0.5,0.5);
%Fin erlenmeyer
\end{tikzpicture}
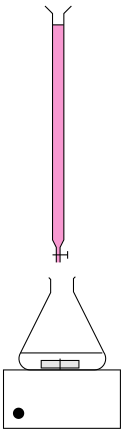
%Montage dosage Mn
\begin{tikzpicture}[scale=0.05]
%Burette
\fill [color=magenta!40] (-2,92) --++(0,-57) --++ (1,-2) --++(0,-4) --++ (1,0) --++ (0,4) --++ (1,2) --++ (0,57) -- cycle;
\draw (-4,97) --++ (2,-2) --++ (0,-60) --++ (1,-2) --++ (0,-4);
\draw (3,97) --++ (-2,-2) --++ (0,-60) --++ (-1,-2) --++ (0,-4);
\draw (-2,92) --++ (3,0);
\draw (-2,31) --++ (4,0);
\draw (2,32) --++ (0,-2);
%Fin burette
%Agitateur
\draw (-10.2,0.5) -- (-15,0.5) -- (-15,-15) -- (16,-15) -- (16,0.5) -- cycle;
\fill (-11,-11) circle (1.5);
%Fin agitateur
%Niveau liquide
\draw (-10.5,5) -- (11.2,5);
%Fin niveau liquide
%Turbulent
\fill [color=gray!20] (-5,1) --++ (0,2) --++ (10,0) --++ (0,-2) -- cycle;
\draw [] (-5,1) --++ (0,2) --++ (10,0) --++ (0,-2) -- cycle;
\draw (0,0.5) --++ (0,3);
%Fin turbulent
%Erlenmeyer
\draw(-3,25) --++ (0.5,-0.5) --++ (0,-3.5) --++ (-8,-16) arc(150:270:3) --++ (17,0) arc(-90:35:3) --++ (-8,16) --++ (0,3.5) --++ (0.5,0.5);
%Fin erlenmeyer
\end{tikzpicture}
 |
 |
 |
%échelle de teinte
\begin{tikzpicture}[scale=0.8]
\foreach \x in {10,20,...,90} \fill[color=blue!\x] (\x/10,1.5) --++ (0,-1.5) arc (-180:0:0.2) --++ (0,1.5) -- cycle;
\foreach \x in {1,2,...,9} \draw (\x,2) --++ (0,-2) arc (-180:-90:0.2) node [below] {$C_{\x}$ } arc (-90:0:0.2)--++ (0,2);
\end{tikzpicture}
\begin{tikzpicture}[x=0.8cm, y=0.8cm]
\draw[step=1mm, line width=0.1mm, black!20!white, semitransparent] (0,0) grid (17,10);
\draw[step=5mm, line width=0.2mm, black!30!white, semitransparent] (0,0) grid (17,10);
\draw[step=1cm, line width=0.3mm, black!50!white, semitransparent] (0,0) grid (17,10);
\draw [->,>=latex] (-0.2,0) --++ (17.5,0) node [below] {V};
\draw [->,>=latex] (0,-0.2) --++ (0,10.5) node [left] {$ \sigma$};
\newcommand{\decroissante}
{(0,9)(1,8.2)(2,7.4)(3,6.6)(4,5.8)(5,5)(6,4.2)(7,3.4)(8,2.6)(9,1.8)}
\draw plot[mark=x,mark size=2mm] coordinates {\decroissante};
\newcommand{\croissante}
{(10,2)(11,3.2)(12,4.4)(13,5.6)(14,6.8)(15,8)(16,9.2)}
\draw plot[mark=x,mark size=2mm] coordinates {\croissante};
\draw [dashed] (9,1.8) --++ (1,-0.8);
\draw [dashed] (10,2) --++ (-1,-1.2);
\draw [dashed,blue] (9.5,0) --++ (0,1.5);
\node [blue] at (9.5,-0.4) {$V_E$};
\end{tikzpicture}
%Montage à reflux
\begin{tikzpicture}[line cap=round,line join=round,>= latex,x=0.07cm,y=0.07cm]
%Annotations
\node[] (Chauf) at (45,-10) { Agitateur chauffant};
\node[] (BM) at (45,5) { Bain-marie};
\node[] (ER) at (30,25) { Erlenmeyer};
\node[] (T) at (35,15) { Turbulent};
\draw[->,>=latex] (Chauf) to[out=180,in=0] (10,-10);
\draw[->,>=latex] (ER) to[out=180,in=0] (4,20);
\draw[->,>=latex] (T) to[out=180,in=90] (0,3);
\draw[->,>=latex] (BM) to[out=180,in=0] (15,3);
\begin{scope}[yshift=14]
\node[] (E) at (-8,30.5) {};
\node[] (S) at (-8,72.5) {};
\node[] (EEF) at (-40,30) { Entrée eau froide};
\node[] (SEF) at (-40,71) { Sortie eau froide};
\node[] (Ref) at (35,45) { Réfrigérant à eau};
\draw[->,>=latex] (EEF) to[out=0,in=180] (E);
\draw[->,>=latex] (S) to[out=180,in=0] (SEF);
\draw[->,>=latex] (Ref) to[out=180,in=0] (4,40);
%Bouchon
\fill[color=gray!80] (-2.5,13.5) rectangle (0,18);
\fill[color=gray!80] (1,13.5) rectangle (3.5,18);
%Refrigerant
\draw (0,7) -- (0,80);%tube central
\draw (1,7) -- (1,80);%tube central
\draw (1,25) arc (-90:0:3) -- (4,75) arc (-0:90:3);
\draw (0,78) arc (90:180:3) -- (-3,73) -- (-6,73);
\draw (-6,72) -- (-3,72) -- (-3,31) -- (-6,31);
\draw (-6,30) -- (-3,30) -- (-3,28) arc (-180:-90:3);
\end{scope}
%Erlenmeyer
\draw(-3,25) --++ (0.5,-0.5) --++ (0,-3.5) --++ (-8,-16) arc(150:270:3) --++ (17,0) arc(-90:35:3) --++ (-8,16) --++ (0,3.5) --++ (0.5,0.5);
%Bain marie
\draw (-14,12) --++ (0,-11.5) --++ (29,0) --++ (0,11.5);
\draw(-14,9) --++ (5,0);
\draw(15,9) --++ (-5,0);
%Agitateur
\draw (-10.2,0.5) -- (-15,0.5) -- (-15,-15) -- (16,-15) -- (16,0.5) -- cycle;
\fill (-11,-11) circle (1.5);
%Turbulent
\fill [color=gray!20] (-5,1) --++ (0,2) --++ (10,0) --++ (0,-2) -- cycle;
\draw [] (-5,1) --++ (0,2) --++ (10,0) --++ (0,-2) -- cycle;
\draw (0,0.5) --++ (0,3);
%Niveau liquide
\draw (-10.5,5) -- (11.2,5);
\end{tikzpicture}
Molécules
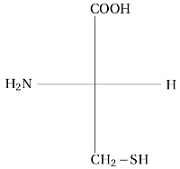 |
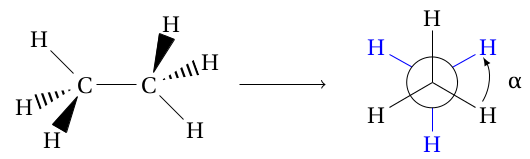 |
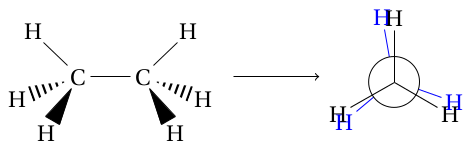 |
\begin{tikzpicture}[scale=1]
%Projection de Fischer
\node (ouest) at (0,0) {$H_2N$};
\node (est) at (4,0) {H};
\node (nord) at (2.4,2) {$COOH$};
\node (sud) at (2.65,-2) {$CH_2-SH$};
\draw[-] (ouest) to[out=0,in=180] (est);
\draw[-] (2,-1.8) -- (2,1.8);
\end{tikzpicture}
\begin{tikzpicture}[scale=1]
\node at(-4,0) {\chemfig{C(<[:240]H)(-[3]H)(<:[:200]H)-C(<:[:20]H)(<[:70]H)(-[7]H)} \chemrel{->} };
\node [color=blue] at (0,-0.2) {\chemfig{[:60](-[::210]H)(-[::90]H)(-[::-30]H)}};
\filldraw [fill=white](0,0) circle (0.4);
\node at (0,0.25) {\chemfig{(-[::210]H)(-[::90]H)(-[::-30]H)}};
\draw [->,>=latex] (0.8,-0.3) arc (-30:30:0.7);
\node () at (1.3,0) {$\alpha$};
\end{tikzpicture}
\begin{tikzpicture}[scale=1]
\node at(-3.5,0) {\chemfig{C(<[:240]H)(-[3]H)(<:[:200]H)-C(<:[:-20]H)(<[:-60]H)(-[1]H)} \chemrel{->} };
\node [color=blue] at (0.08,0.2) {\chemfig{[:10](-[::210]H)(-[::90]H)(-[::-30]H)}};
\filldraw [fill=white](0,0) circle (0.4);
\node at (0,0.25) {\chemfig{(-[::210]H)(-[::90]H)(-[::-30]H)}};
\end{tikzpicture}
 |
\begin{tikzpicture}
%protéine
\tikzstyle{gly}=[rectangle,draw,rounded corners=4pt,fill=blue!25,minimum height=0.7cm]
\tikzstyle{ala}=[rectangle,draw,rounded corners=4pt,fill=red!25,minimum height=0.7cm]
\tikzstyle{val}=[rectangle,draw,rounded corners=4pt,fill=green!25,minimum height=0.7cm]
\tikzstyle{lys}=[rectangle,draw,rounded corners=4pt,fill=gray!25,minimum height=0.7cm]
\tikzstyle{ser}=[rectangle,draw,rounded corners=4pt,fill=yellow!25,minimum height=0.7cm]
\tikzstyle{leu}=[rectangle,draw,rounded corners=4pt,fill=cyan!25,minimum height=0.7cm]
\tikzstyle{phe}=[rectangle,draw,rounded corners=4pt,fill=magenta!25,minimum height=0.7cm]
\node (0) at (-1,0) {$H_2N$};
\node[gly] (1) at (0,0) {Gly};
\node[phe] (2) at (1,0) {Phe};
\node[ala] (3) at (2,0) {Ala};
\node[val] (4) at (3,0) {Val};
\node[ala] (5) at (4,0) {Ala};
\node[gly] (6) at (5,0) {Gly};
\node[ser] (7) at (6,0) {Ser};
\node[ser] (8) at (7,0) {Ser};
\node[leu] (9) at (8,0) {Leu};
\node[phe] (10) at (9,0) {Phe};
\node[lys] (11) at (10,0) {Lys};
\node[val] (12) at (11,0) {Val};
\node[ala] (13) at (12,0) {Ala};
\node[leu] (14) at (13,0) {Leu};
\node[gly] (15) at (14,0) {Gly};
\node[ser] (16) at (15,0) {Ser};
\node[leu] (17) at (16,0) {Leu};
\node (18) at (17.2,0) {COOH};
\draw[] (0) to[out=0,in=180] (1);
\draw[] (1) to[out=0,in=180] (2);
\draw[] (2) to[out=0,in=180] (3);
\draw[] (3) to[out=0,in=180] (4);
\draw[] (4) to[out=0,in=180] (5);
\draw[] (5) to[out=0,in=180] (6);
\draw[] (6) to[out=0,in=180] (7);
\draw[] (7) to[out=0,in=180] (8);
\draw[] (8) to[out=0,in=180] (9);
\draw[] (9) to[out=0,in=180] (10);
\draw[] (10) to[out=0,in=180] (11);
\draw[] (11) to[out=0,in=180] (12);
\draw[] (12) to[out=0,in=180] (13);
\draw[] (13) to[out=0,in=180] (14);
\draw[] (14) to[out=0,in=180] (15);
\draw[] (15) to[out=0,in=180] (16);
\draw[] (16) to[out=0,in=180] (17);
\draw[] (17) to[out=0,in=180] (18);
\end{tikzpicture}
 |
 |
 |
 |
\begin{tikzpicture} %modèle de l'eau \draw [rounded corners=4pt,color=white,ball color=gray!10,smooth] (0,0) circle (0.4) ; \draw[color=gray!30,line width=5pt,cap=round](0.3,0.1) -- (1,0.3); \draw [rounded corners=4pt,color=white,ball color=red!80,smooth] (1.5,0.5) circle (0.8) ; \draw[color=gray!30,line width=5pt,cap=round](1.5,1.7) -- (1.5,1.1); \draw [rounded corners=4pt,color=white,ball color=gray!10,smooth] (1.5,2) circle (0.4) ; \end{tikzpicture}
\begin{tikzpicture} %modèle du méthane \draw [rounded corners=4pt,color=white,ball color=gray!10,smooth] (0,0) circle (0.4) ; \draw [rounded corners=4pt,color=white,ball color=gray!10,smooth] (3,0) circle (0.4) ; \draw[color=gray!30,line width=5pt,cap=round](0.3,0.1) -- (1,0.3); \draw[color=gray!30,line width=5pt,cap=round](2.1,0.3) -- (2.7,0.1); \draw [rounded corners=4pt,color=white,ball color=gray!80,smooth] (1.5,0.5) circle (0.7) ; \draw[color=gray!30,line width=5pt,cap=round](1.5,1.7) -- (1.5,1.1); \draw [rounded corners=4pt,color=white,ball color=gray!10,smooth] (1.5,2) circle (0.4) ; \draw[color=gray!30,line width=5pt,cap=round](1.8,0) -- (2.1,-0.5); \draw [rounded corners=4pt,color=white,ball color=gray!10,smooth] (2.3,-0.8) circle (0.4) ; \end{tikzpicture}
\begin{tikzpicture} %modèle de l'ammoniac \draw [rounded corners=4pt,color=white,ball color=gray!10,smooth] (0,0) circle (0.4) ; \draw [rounded corners=4pt,color=white,ball color=gray!10,smooth] (3,0) circle (0.4) ; \draw[color=gray!30,line width=5pt,cap=round](0.3,0.1) -- (1,0.3); \draw[color=gray!30,line width=5pt,cap=round](2.1,0.3) -- (2.7,0.1); \draw [rounded corners=4pt,color=white,ball color=blue!80,smooth] (1.5,0.5) circle (0.75) ; \draw[color=gray!30,line width=5pt,cap=round](1.8,0) -- (2.1,-0.5); \draw [rounded corners=4pt,color=white,ball color=gray!10,smooth] (2.3,-0.8) circle (0.4) ; \end{tikzpicture}
\begin{tikzpicture} %modèle méthanal \draw [rounded corners=4pt,color=white,ball color=red!80,smooth] (0,0) circle (0.8) ; \draw [rounded corners=4pt,color=white,ball color=gray!80,smooth] (2.5,0) circle (0.7) ; \draw[color=gray!30,line width=5pt,cap=round](0.7,0.2) --++ (1.1,0); \draw[color=gray!30,line width=5pt,cap=round](0.7,-0.2) --++ (1.1,0); \draw [rounded corners=4pt,color=white,ball color=gray!80,smooth] (2.5,0) circle (0.7) ; \draw[color=gray!30,line width=5pt,cap=round](3,-0.5) --++ (0.4,-0.4); \draw[color=gray!30,line width=5pt,cap=round](3,0.5) --++ (0.4,0.4); \draw [rounded corners=4pt,color=white,ball color=gray!10,smooth] (3.7,-1.2) circle (0.4) ; \draw [rounded corners=4pt,color=white,ball color=gray!10,smooth] (3.7,1.2) circle (0.4) ; \end{tikzpicture}
Un peu de maths
 |
 |
\begin{tikzpicture}[> = stealth,scale=0.8] \def\xA{0} \def\yA{0} \def\xB{4} \def\yB{5} \def\xC{7} \def\yC{1} \def\rayon{1.5}%rayon de l'arc \coordinate (A) at (\xA,\yA); \coordinate (B) at (\xB,\yB); \coordinate (C) at (\xC,\yC); %\draw[gray,step=1cm] (0,0) grid +(9cm,6cm); %triangle \draw (A)node [left]{A} --(B)node[above]{B}--(C)node[right]{C}--cycle; \node[below] at ({(\xC+\xA)/2},{(\yC+\yA)/2}){b}; \node[right] at ({(\xC+\xB)/2},{(\yC+\yB)/2}){a}; \node[above] at ({(\xB+\xA)/2},{(\yB+\yA)/2}){c}; %angle en A \draw [fill=yellow!50] (A) -- ++({atan((\yC-\yA)/(\xC-\xA))}:\rayon) arc({atan((\yC-\yA)/(\xC-\xA))}:{atan((\yB-\yA)/(\xB-\xA))}:\rayon) -- cycle; \node at ({(atan((\yB-\yA)/(\xB-\xA))+atan((\yC-\yA)/(\xC-\xA)))/2}:{\rayon+0.3}) { $\widehat{A}$ }; %angle en B \begin{scope}[xshift={\xB-\xA},yshift={\yB-\yA},rotate={180+atan((\yB-\yA)/(\xB-\xA))}] \draw [color=white] (B) -- ++({(atan((\xB-\xA)/(\yB-\yA))+atan((\xB-\xC)/(\yC-\yB)))/2}:\rayon+0.3) node[color=black] { $\widehat{B}$ }; \draw [fill=blue!30] (B) -- ++(0:\rayon) arc(0:{atan((\xB-\xA)/(\yB-\yA))+atan((\xB-\xC)/(\yC-\yB))}:\rayon) -- cycle; \end{scope} %angle en C \begin{scope}[xshift={\xC-\xA},yshift={\yC-\yA},rotate={90+atan((\xC-\xB)/(\yB-\yC))}] \draw [color=white] (C) -- ++({(atan((\yB-\yC)/(\xC-\xB))+atan((\yC-\yA)/(\xC-\xA)))/2}:\rayon+0.3) node[color=black] { $\widehat{C}$ }; \draw [fill=red!30] (C) -- ++(0:\rayon) arc(0:{atan((\yB-\yC)/(\xC-\xB))+atan((\yC-\yA)/(\xC-\xA))}:\rayon) -- cycle; \end{scope} \end{tikzpicture}
\begin{tikzpicture}[scale=1] \def \R{4}; %rayon du grand cercle \def \r{2}; %rayon du petit cercle \def \ratio{5.3}; %rapport des vitesses de rotation %\clip(-0.5,-2.5) rectangle (14,6); \draw[domain=0:400,samples=300,smooth] plot ({\R*cos(\x)+\r*cos(\ratio*\x)},{\R*sin(\x)+\r*sin(\ratio*\x)}); % \x est l'angle en degré \draw[dotted] (\R,0)circle(\r); \draw[dotted] (0,0)circle(\R); \end{tikzpicture}